Impact of Climate Change on Flight Experience
Indian Aviation · Climate Correlation · Predictive Travel Planning
Project TypeMS Data Visualization Thesis
FocusIndian Aviation, Climate Correlation, Predictive Travel Planning
DataIMD Climate · DGCA Aviation (2014–2018)
01. The Research Objective
India’s aviation sector is uniquely vulnerable to seasonal volatility — from the intense Monsoon season to extreme heatwaves.
- The Problem: Travelers often book flights months in advance without understanding that certain airlines and routes are statistically more likely to fail during specific weather windows (e.g., fog in Delhi or heavy rain in Mumbai).
- The Goal: To analyze and visualize the correlation between India’s climate data (Rainfall & Temperature) and flight cancellations across major domestic carriers from 2014 to 2018.
02. Data Synthesis: Climate vs. Carriers
I merged two distinct data streams to build this analysis:
- Climate Metrics: 5 years of daily rainfall and temperature records from the Indian Meteorological Department (IMD) across major hubs (Delhi, Mumbai, Bangalore, Chennai, Kolkata).
- Aviation Logs: Historical cancellation data for major Indian airlines (IndiGo, Air India, SpiceJet, etc.) sourced from the DGCA (Directorate General of Civil Aviation).
03. Visualization Strategy: The Interactive Narrative
The dashboard was designed to move a user from “Data Discovery” to “Flight Cancellations.”
A. The Monsoon Impact Map
- Visual Choice: A dual-layer geospatial map. One layer shows rainfall intensity (isohyets); the other shows the frequency of flight cancellations.
- The Insight: Users can observe how the “Monsoon Front” moves across India, and how cancellation rates spike at specific airports like Mumbai (BOM) or Kochi (COK) during peak rain months.
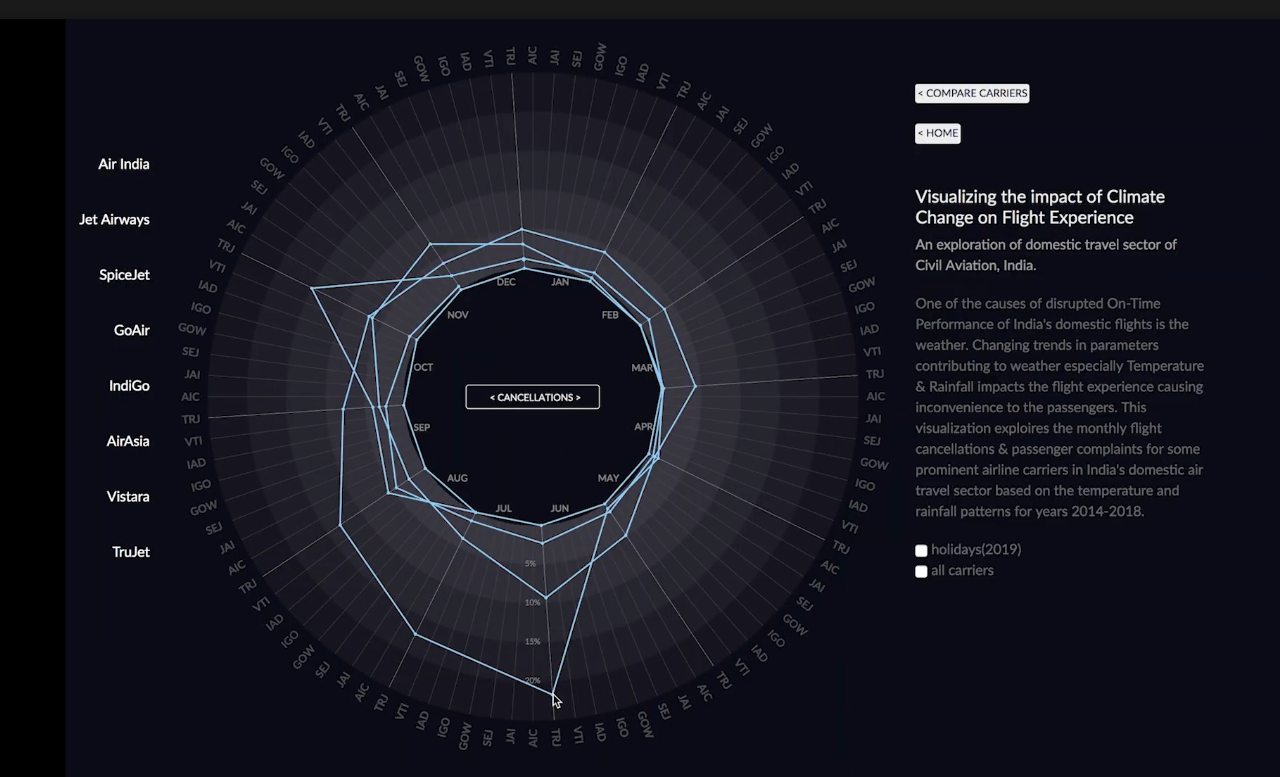
B. The Airline Reliability Radar
- Visual Choice: A Grouped Bar Chart or Heatmap comparing airlines.
- The Insight: This compares how different carriers handle the same weather conditions. For example, does Airline A have better operational resilience during extreme heatwaves (45°C+) in North India compared to Airline B?
Comparative Benchmarking: A side-by-side view allowing travelers to see, for instance, SpiceJet vs. IndiGo’s performance during the same 2017 monsoon season.
04. Thesis Conclusion & Value Proposition
- The Finding: The data revealed that while rainfall is the primary driver of cancellations in the South and West, extreme summer temperatures are becoming a significant operational hurdle for takeoff performance in the North.
- The Impact: This project serves as a Consumer Advocacy Tool, empowering Indian travelers to choose airlines with higher weather resilience and avoid high-risk travel windows.