Data Visualization for Healthcare Marketing Science
Clinical Data Storytelling · Healthcare Analytics Reporting · Information Design
RoleData Visualization Specialist
DepartmentMarketing Science
Core ExpertiseClinical Data, AE Insights, Information Design
01. Professional Overview
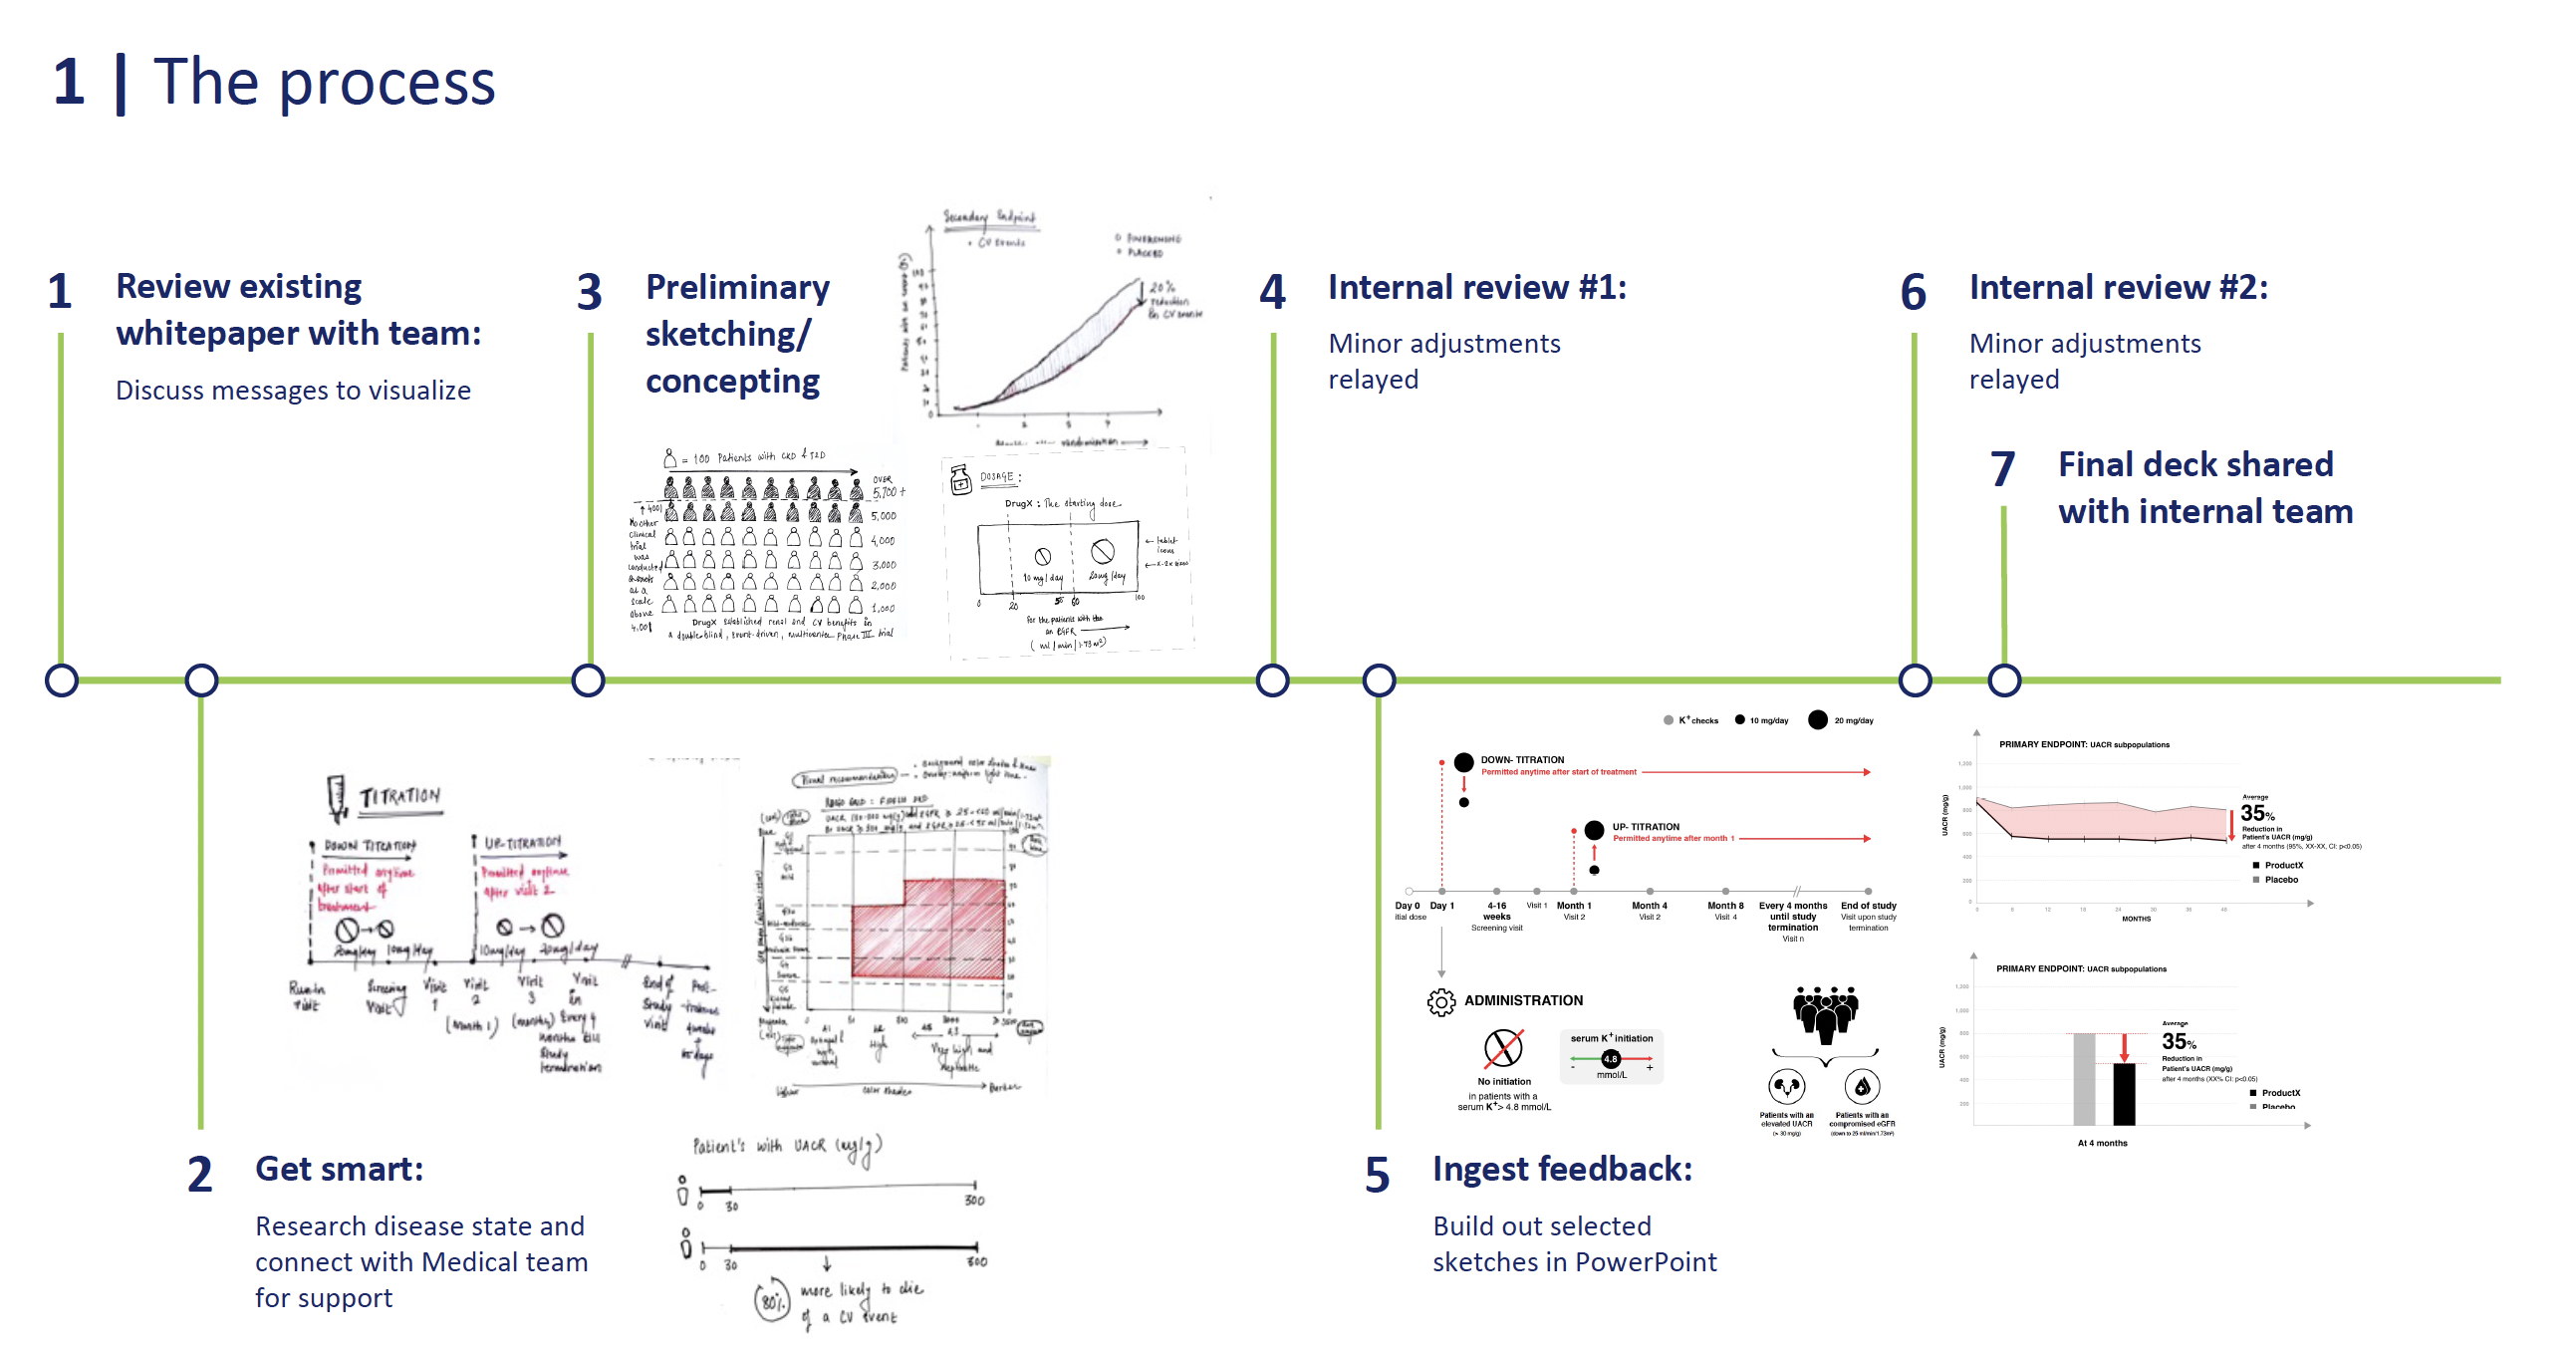
In this role, I followed a rigorous seven-step end-to-end design process to ensure clinical accuracy and visual impact:
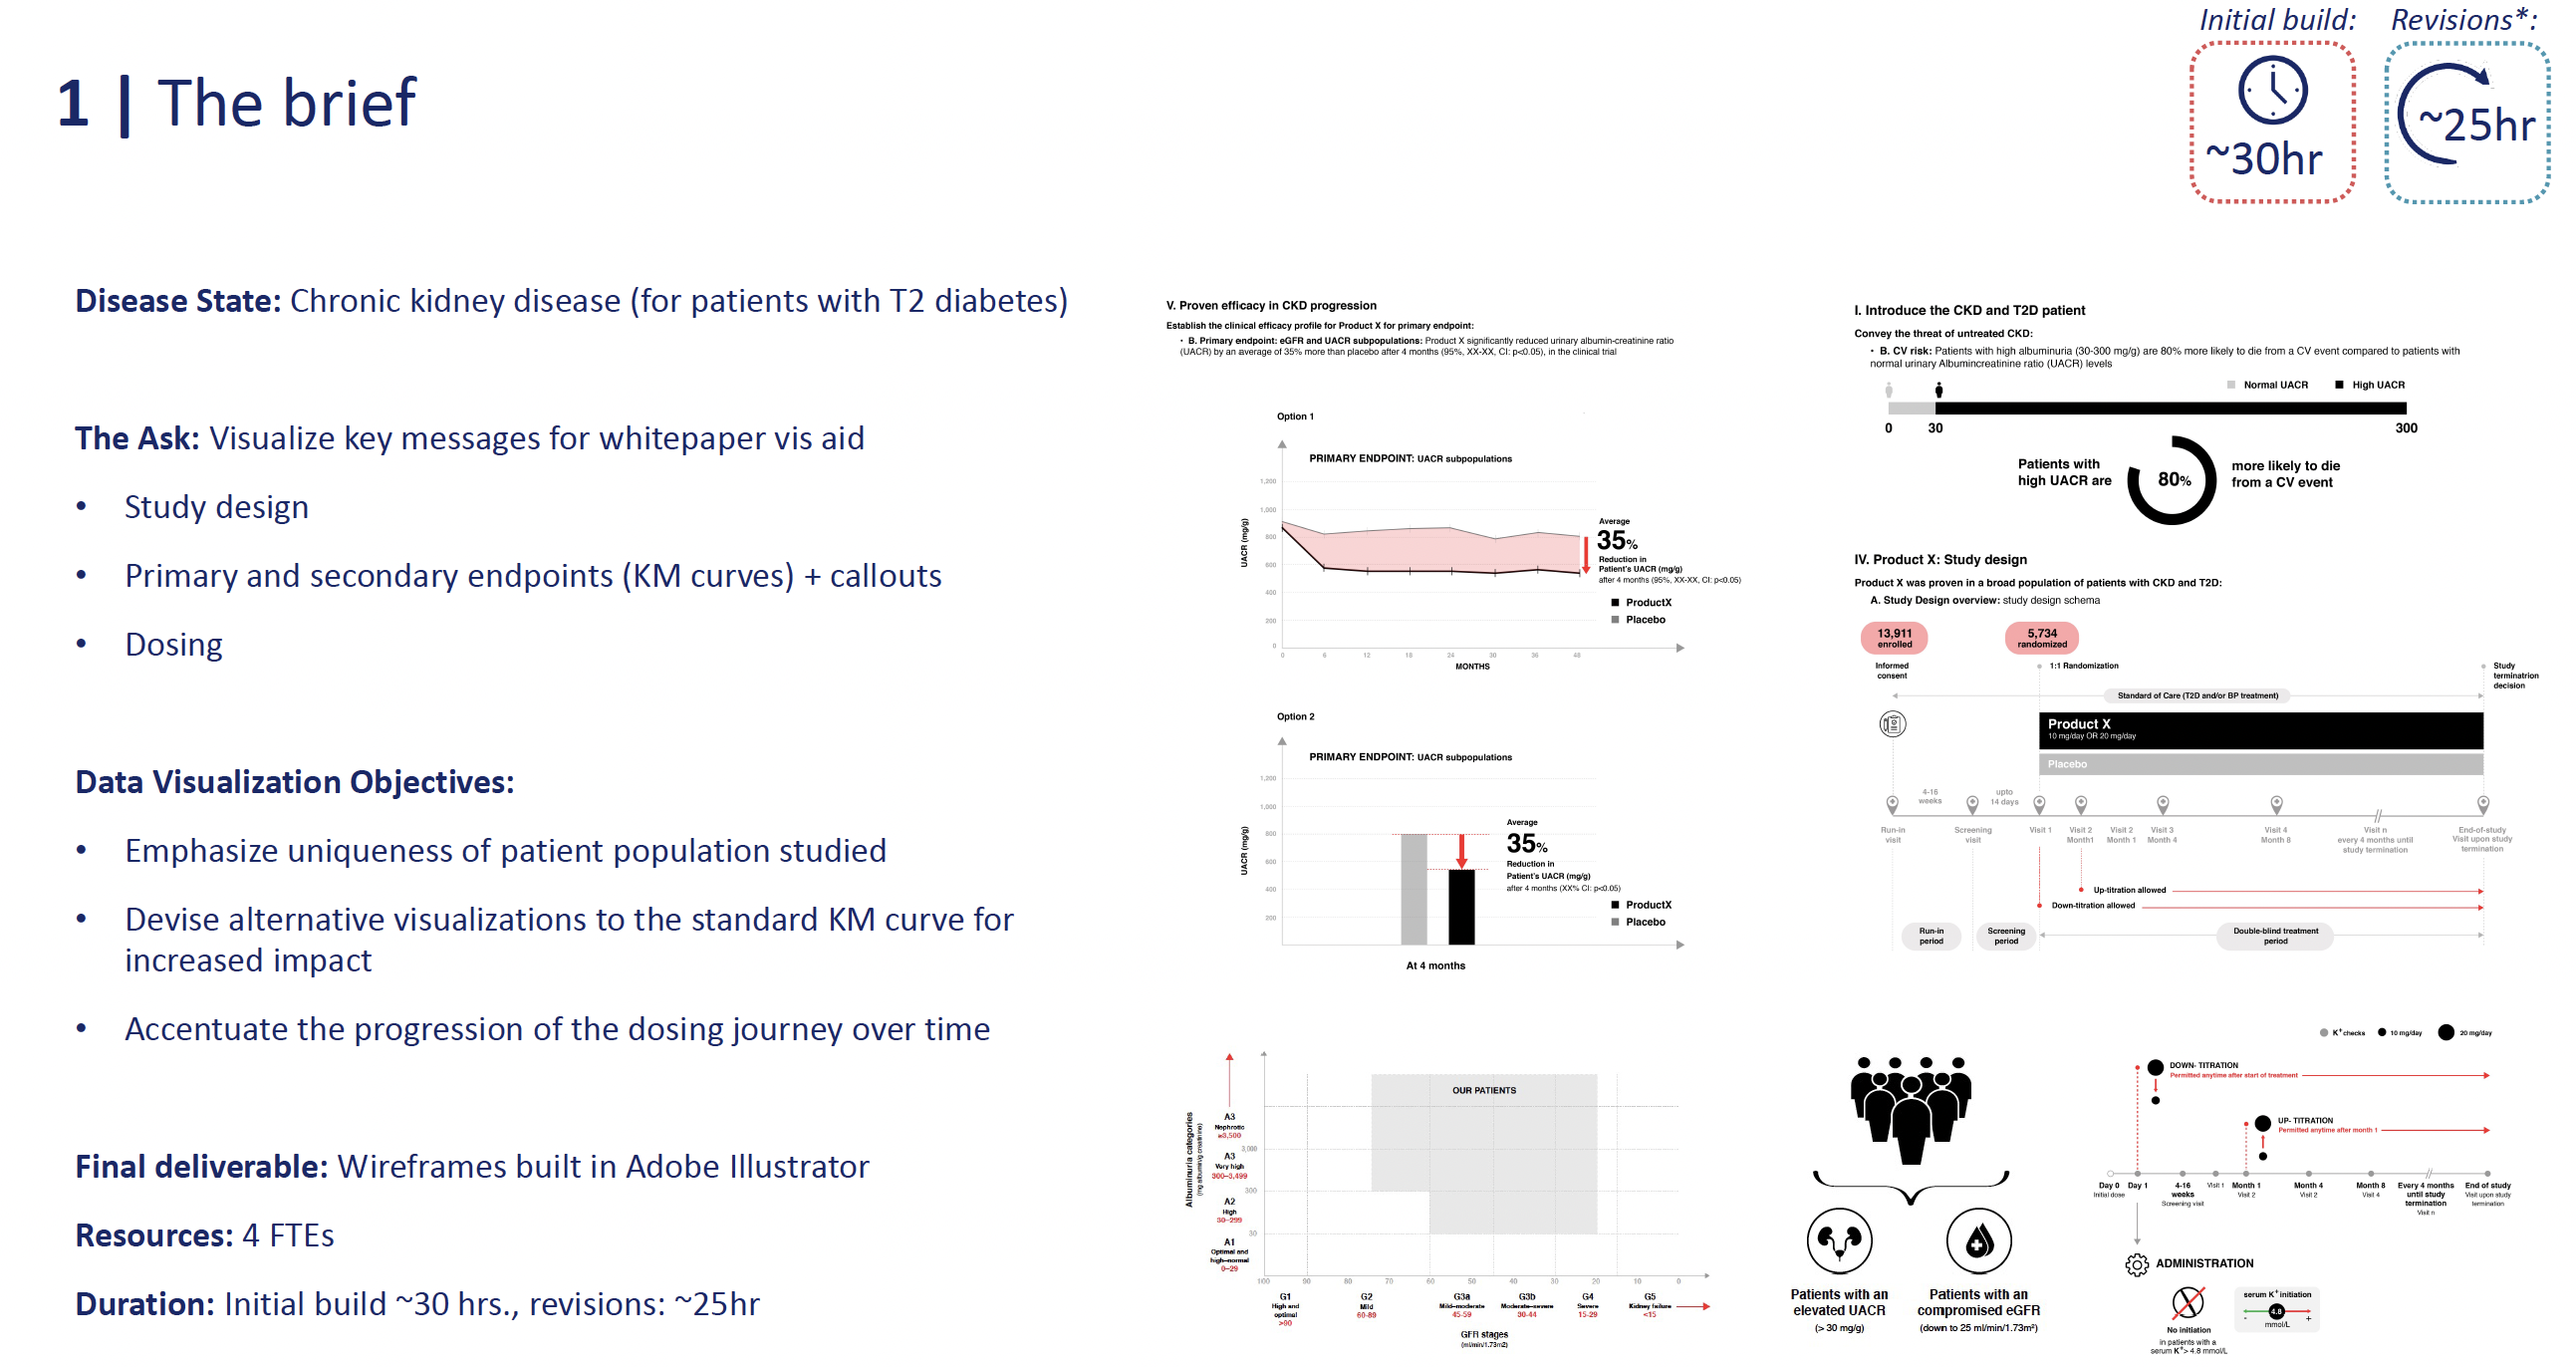
- Understanding the brief: Identifying the specific disease state and clinical efficacy profile.
- Research & Discovery: Deep-diving into disease states (e.g., CKD, ALS, Breast Cancer) and collaborating with Medical Teams for support.
- Data Collection & Aggregation: Ingesting feedback from internal and client reviews to refine datasets.
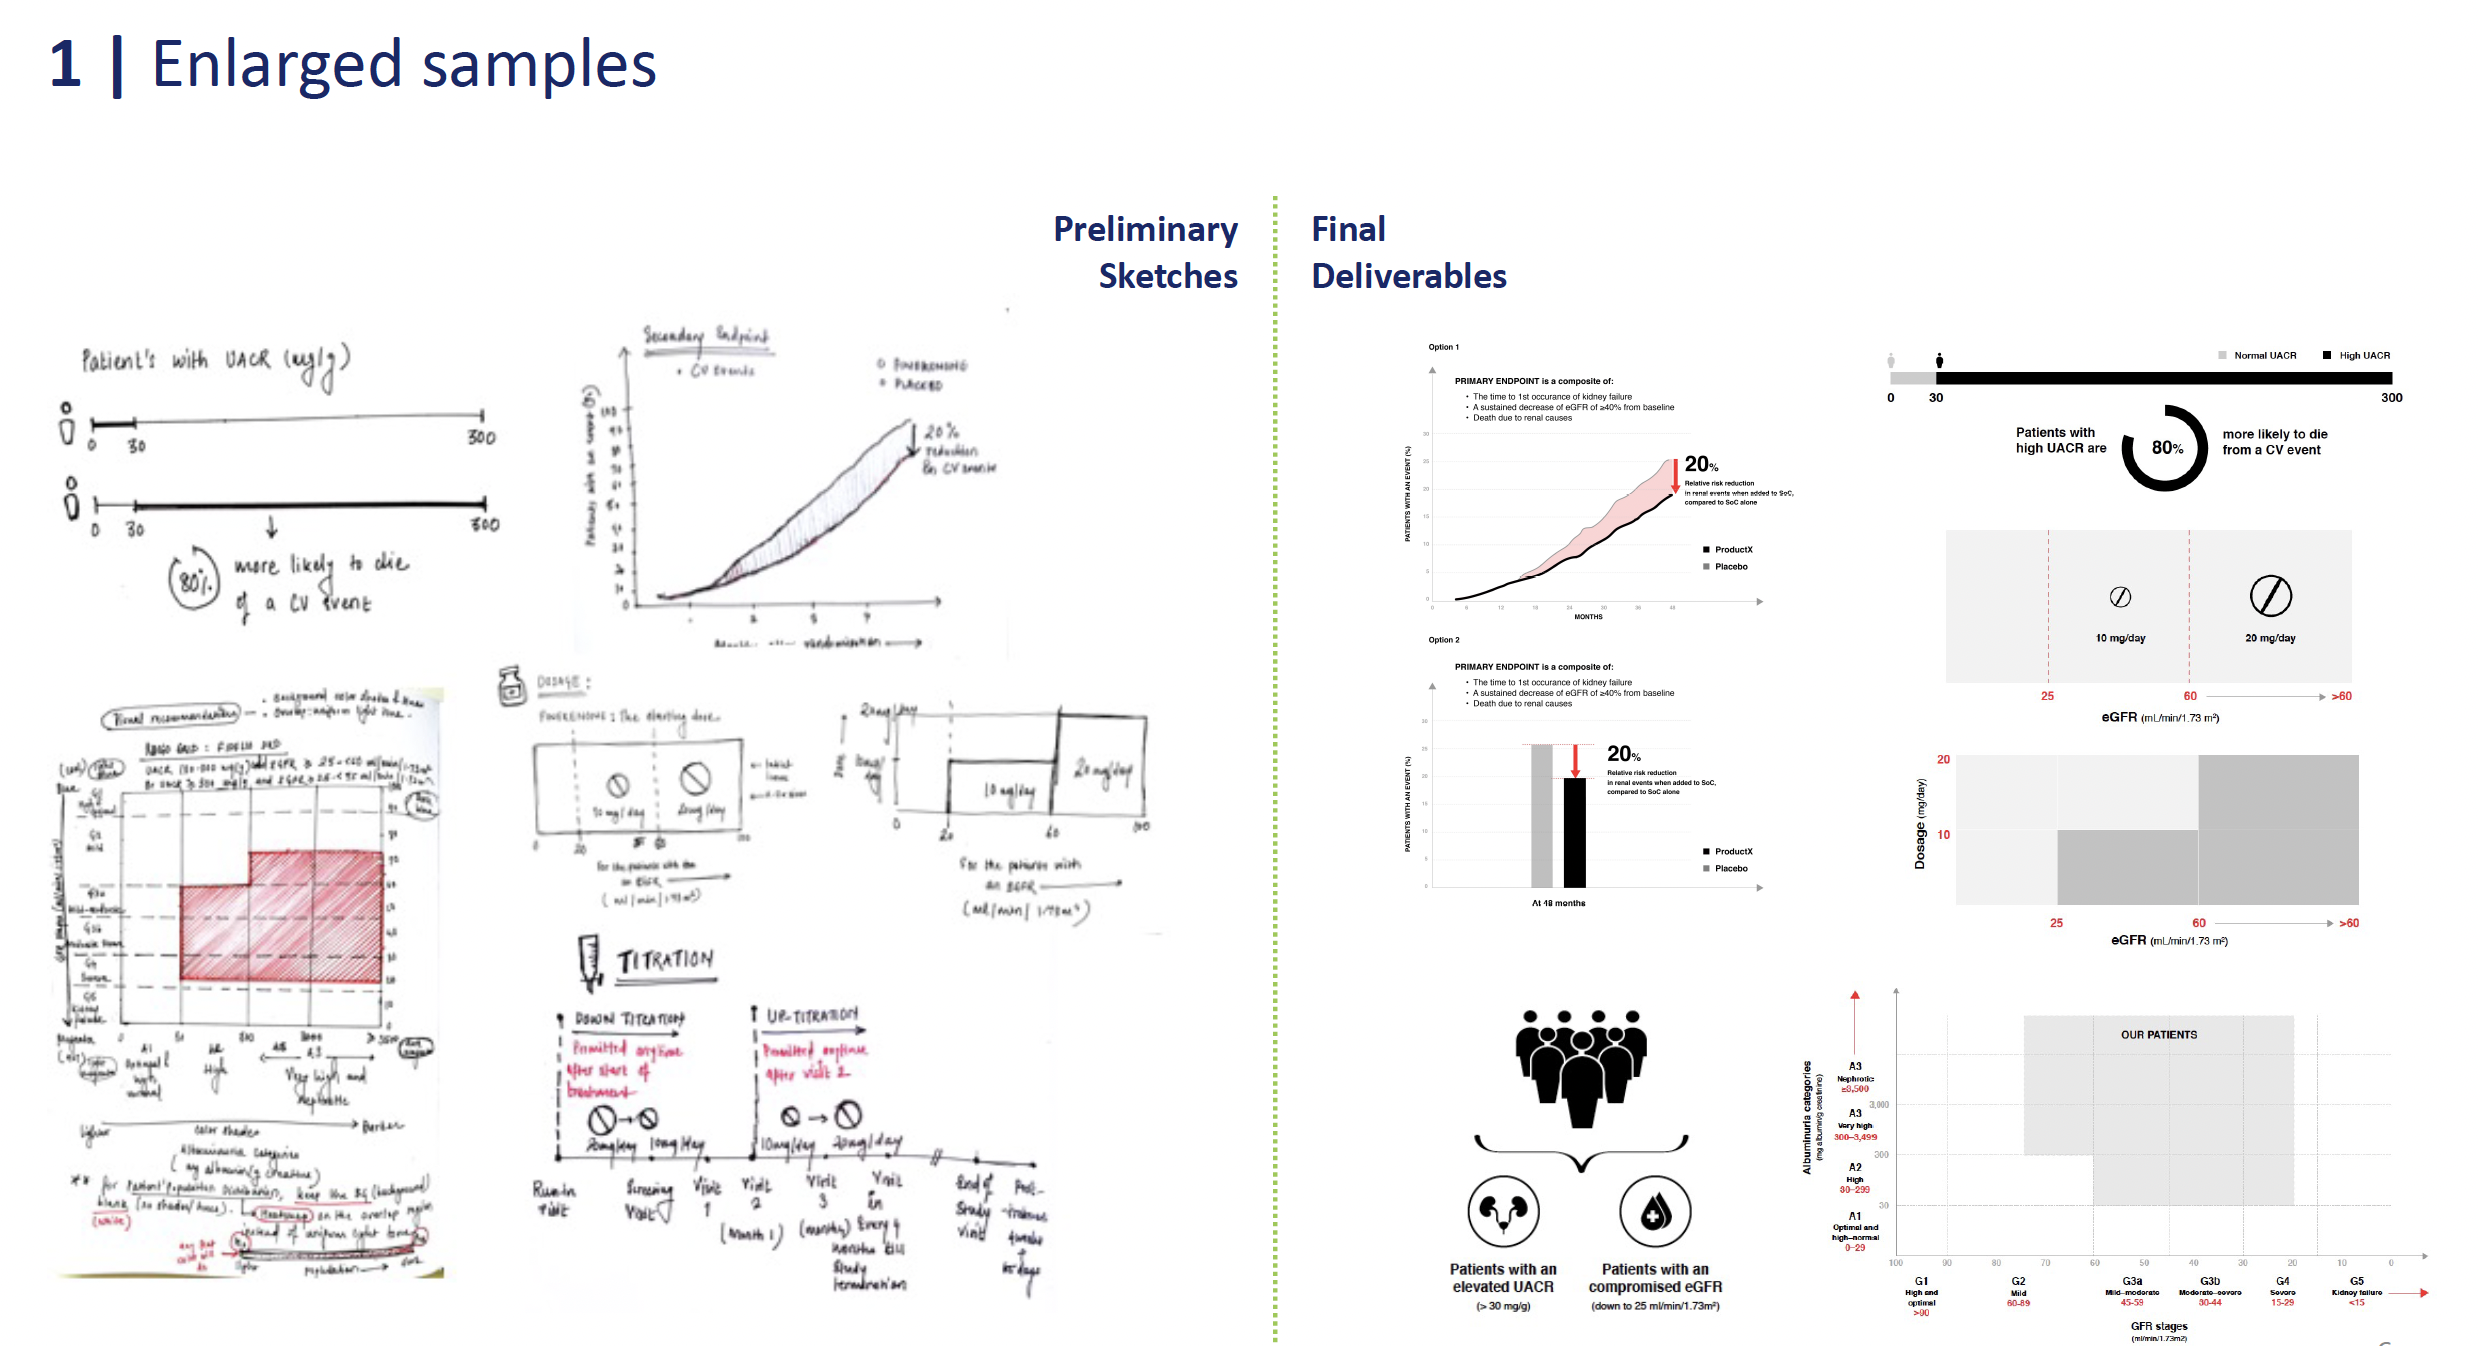
- Concept Sketching & Iteration: Developing preliminary wireframes and layouts to humanize data.
- Final Representation: Delivering high-fidelity visuals in formats ranging from Adobe Illustrator wireframes to interactive PowerPoint decks.
02. Clinical Efficacy & Study Design Visualizations
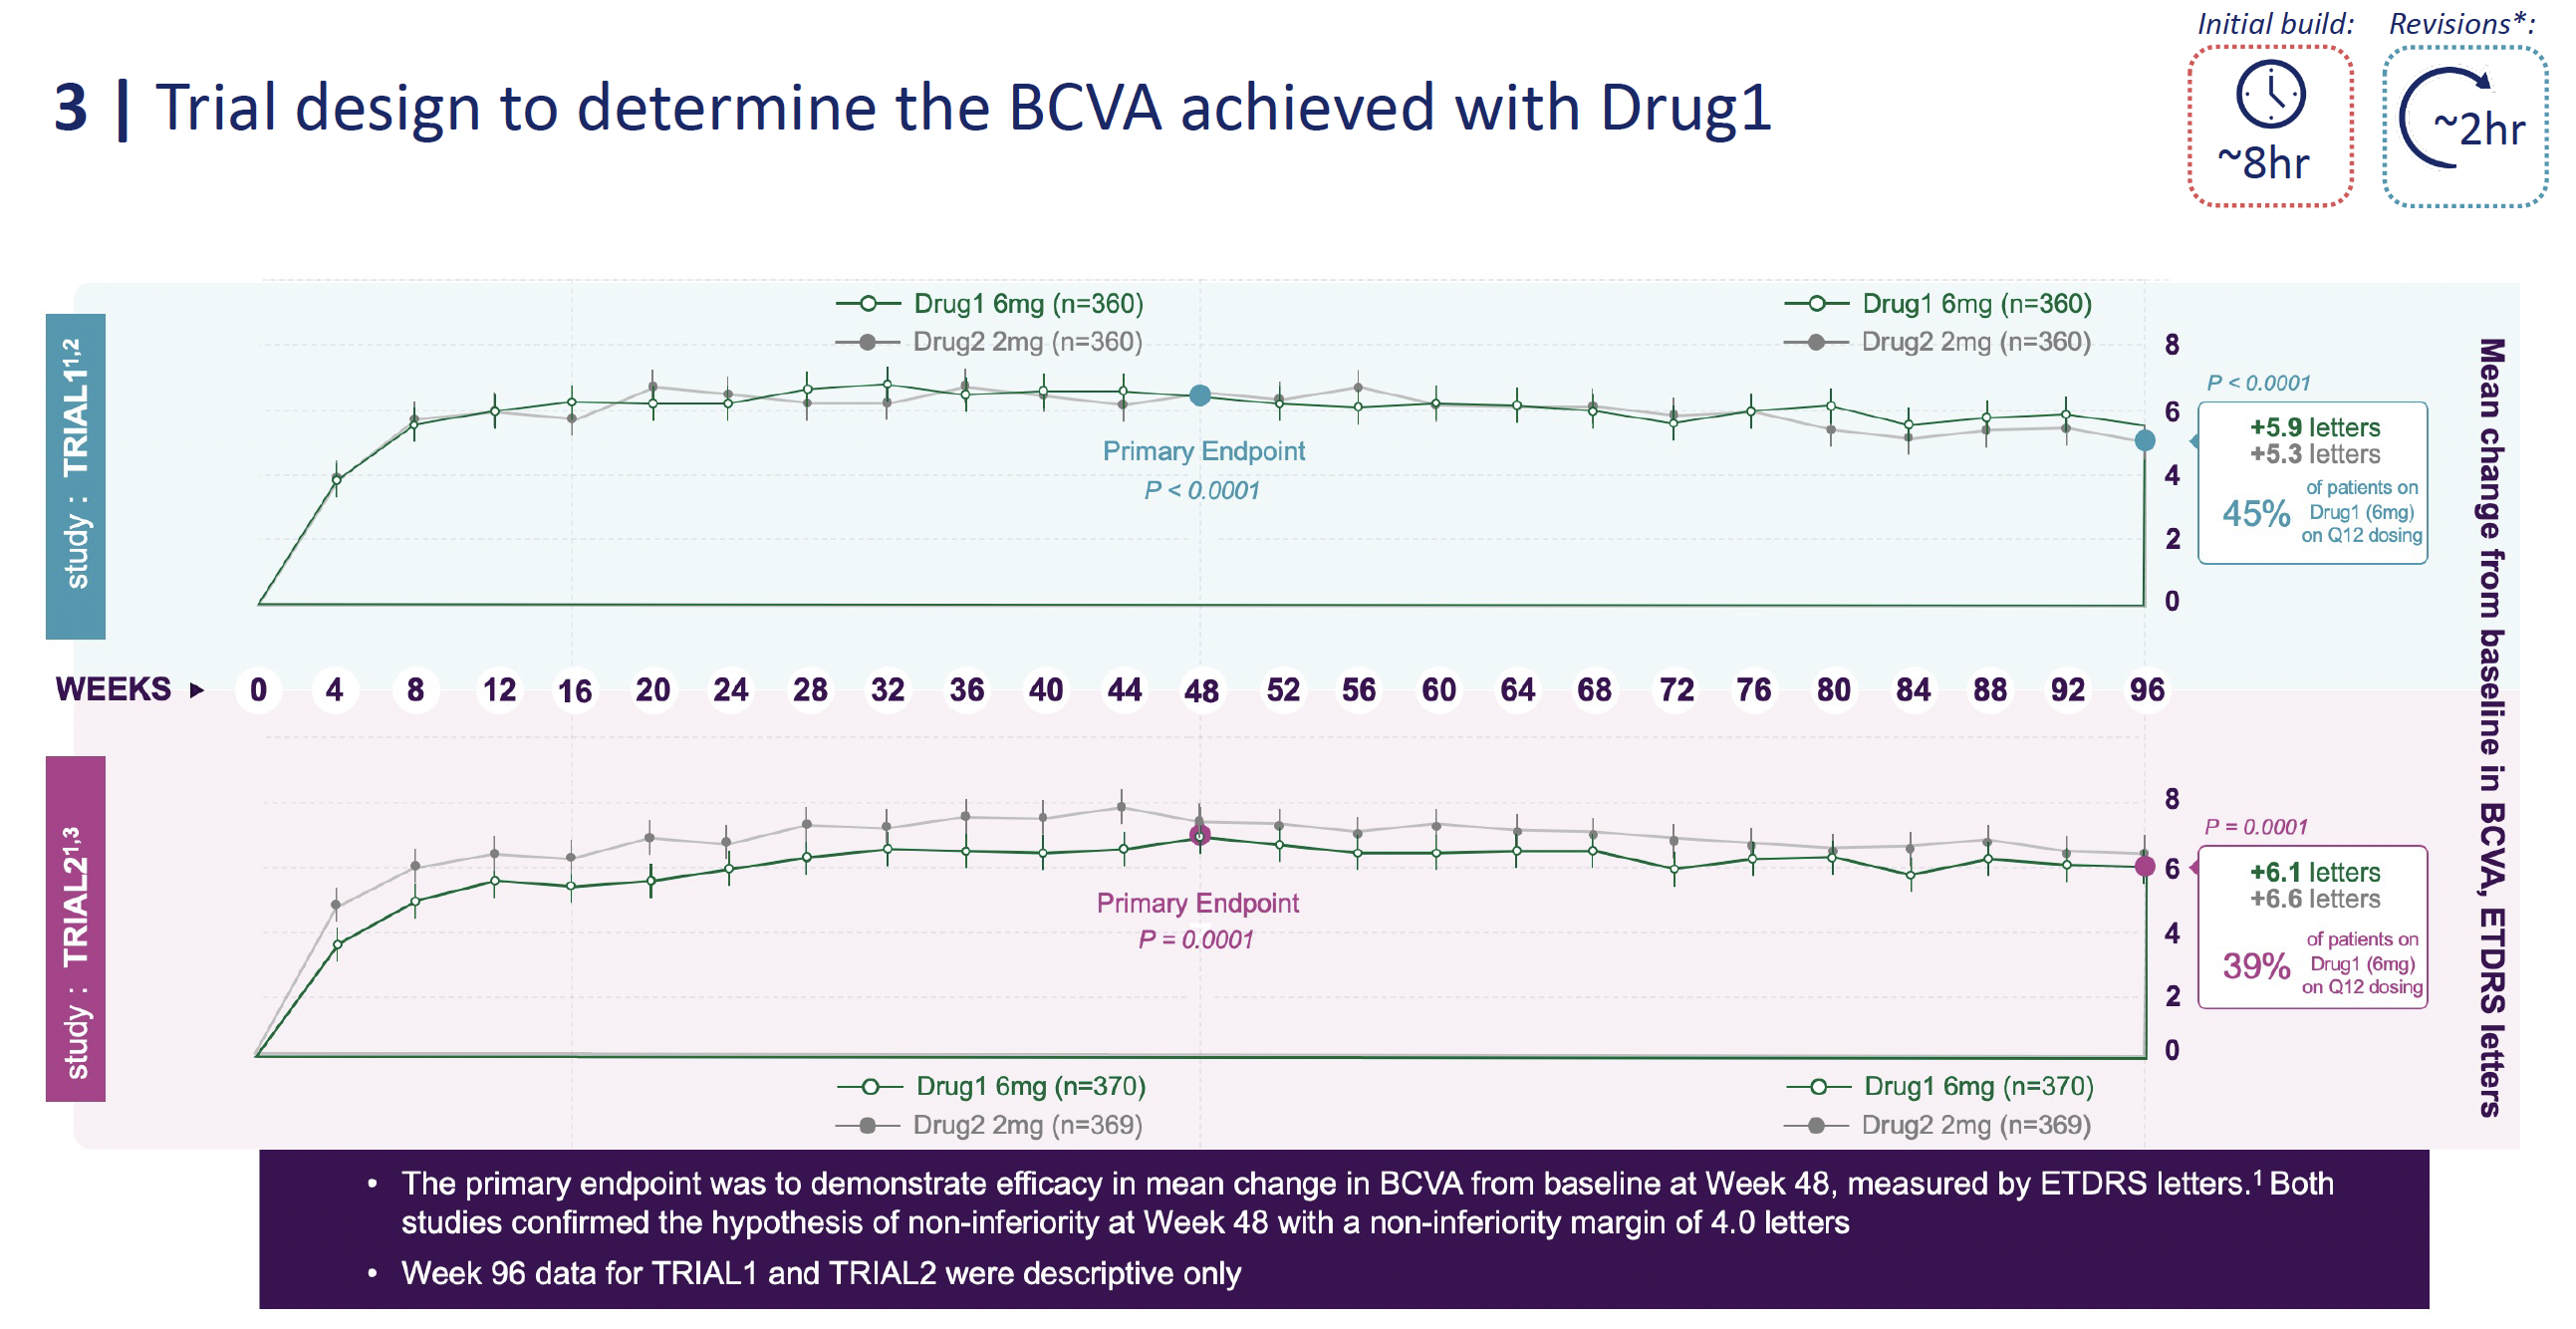
I reimagined traditional clinical charts to make complex efficacy data more intuitive for HCPs.
- Chronic Kidney Disease (CKD): Devised alternative visualizations to standard Kaplan-Meier (KM) curves to emphasize the uniqueness of patient populations and the threat of untreated disease.
- ALS Treatment Urgency: Boldly reimagined existing creative layouts for Amyotrophic Lateral Sclerosis (ALS) to move specialists toward a new standard of care. I transitioned from a purely quantitative approach to one that humanized the data to elicit empathy and create a sense of urgency.
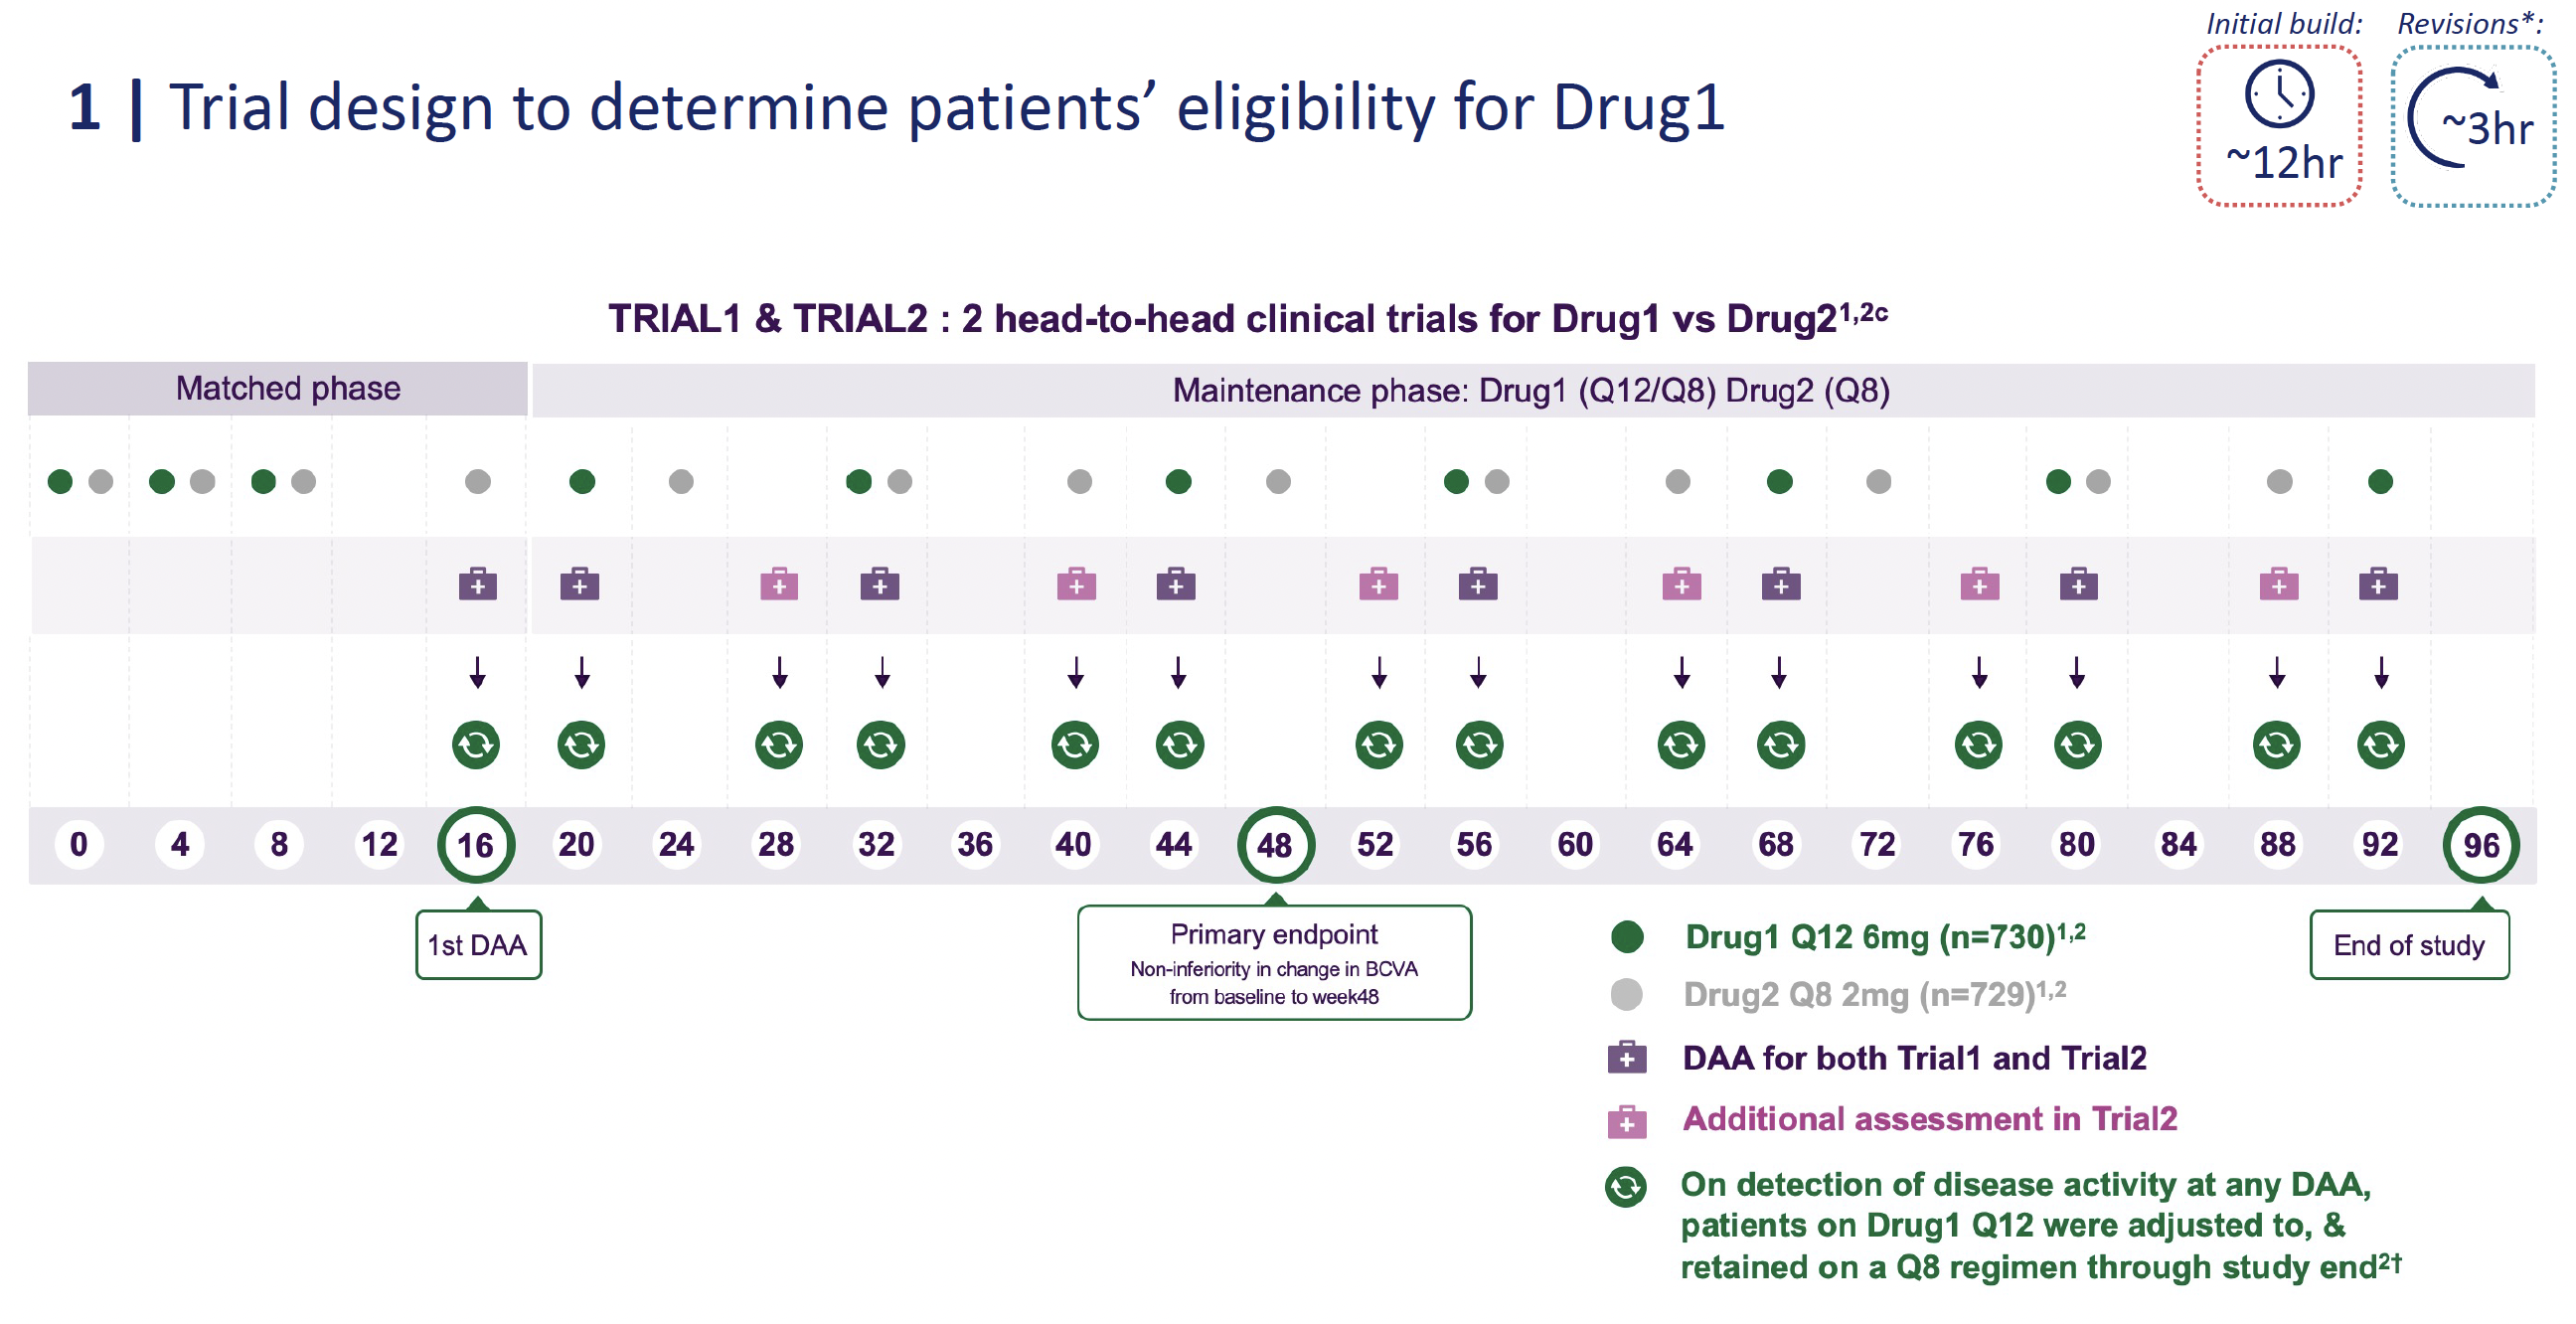
- Dosing Journeys: Accentuated titration and dosing journeys over time using clear, visual progression timelines.
03. Adverse Event (AE) Insights & Inquiry Tracking
For high-stakes oncology brands (e.g., HER2+ Metastatic Breast Cancer), I visualized real-world data to identify unmet information needs.
- Tracking Success: Tracked the evolution of AE queries from HCPs by month and category (e.g., Alopecia, Neutropenia, ILD).
- Categorization: Analyzed inquiry trends across Clinical Data, Management, Monitoring, and COVID-19 implications to help brands respond effectively to HCP concerns.
04. Marketing Science & Information Design
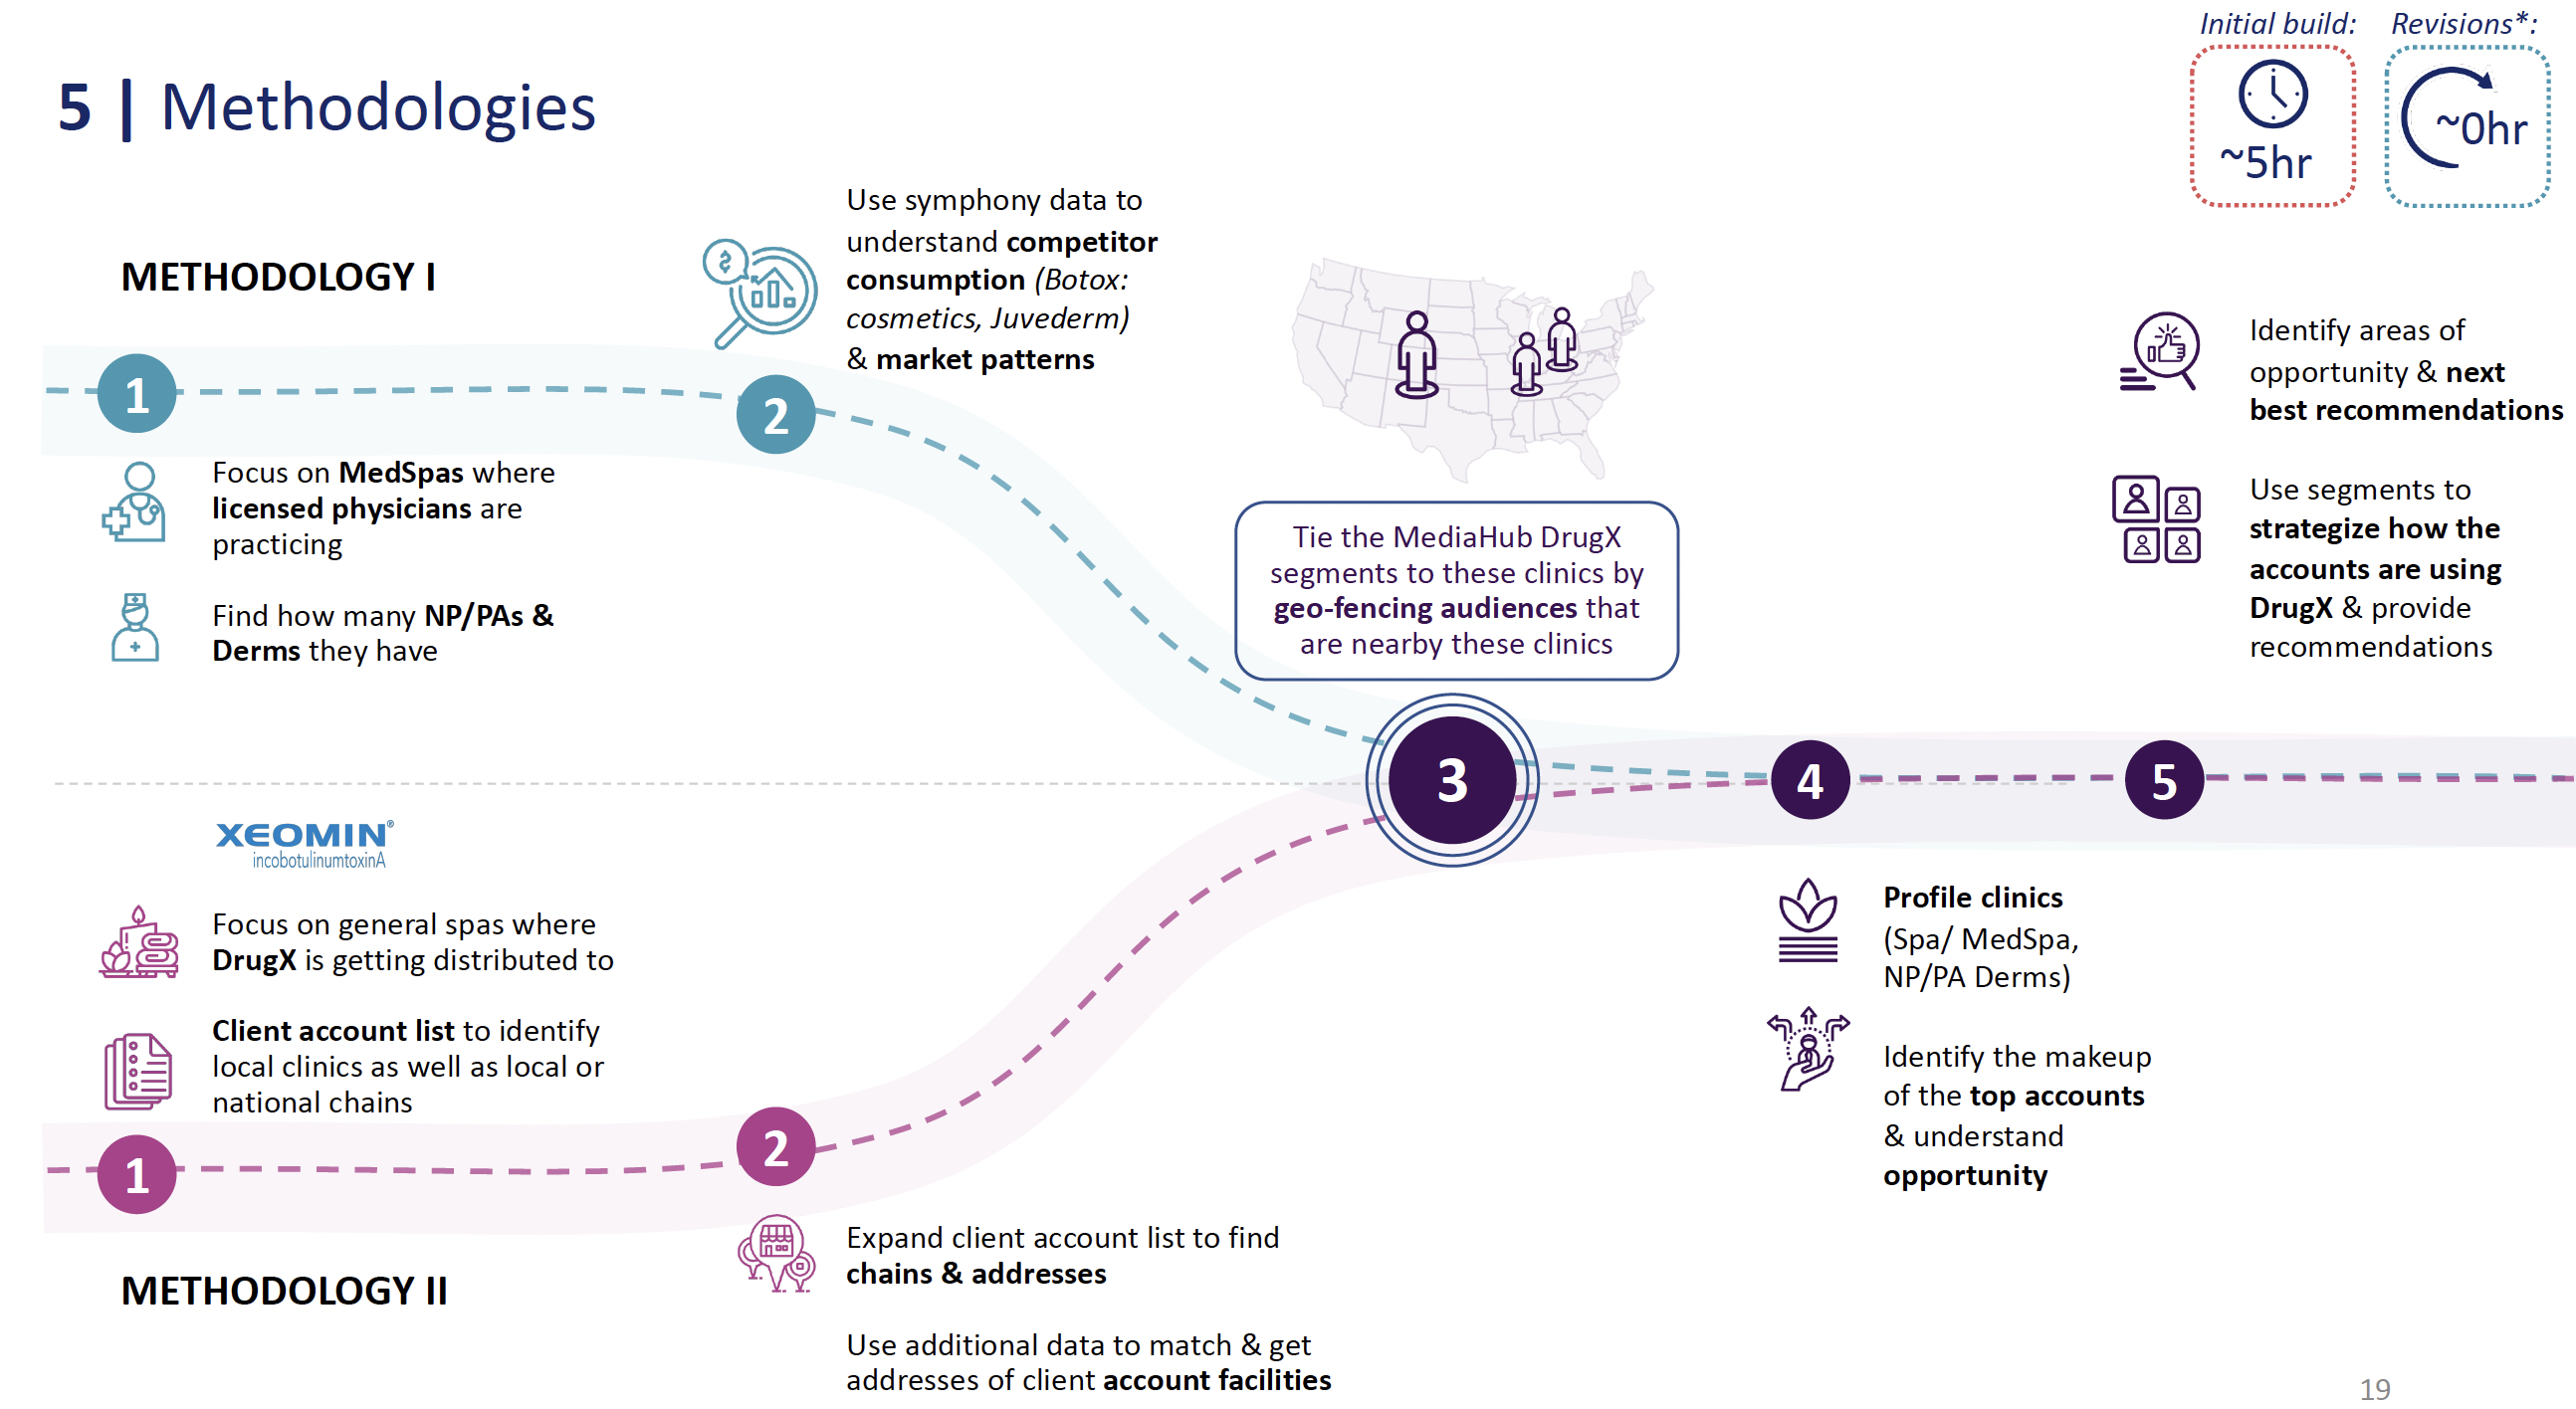
Beyond clinical data, I simplified verbose processes and market intelligence into digestible formats.
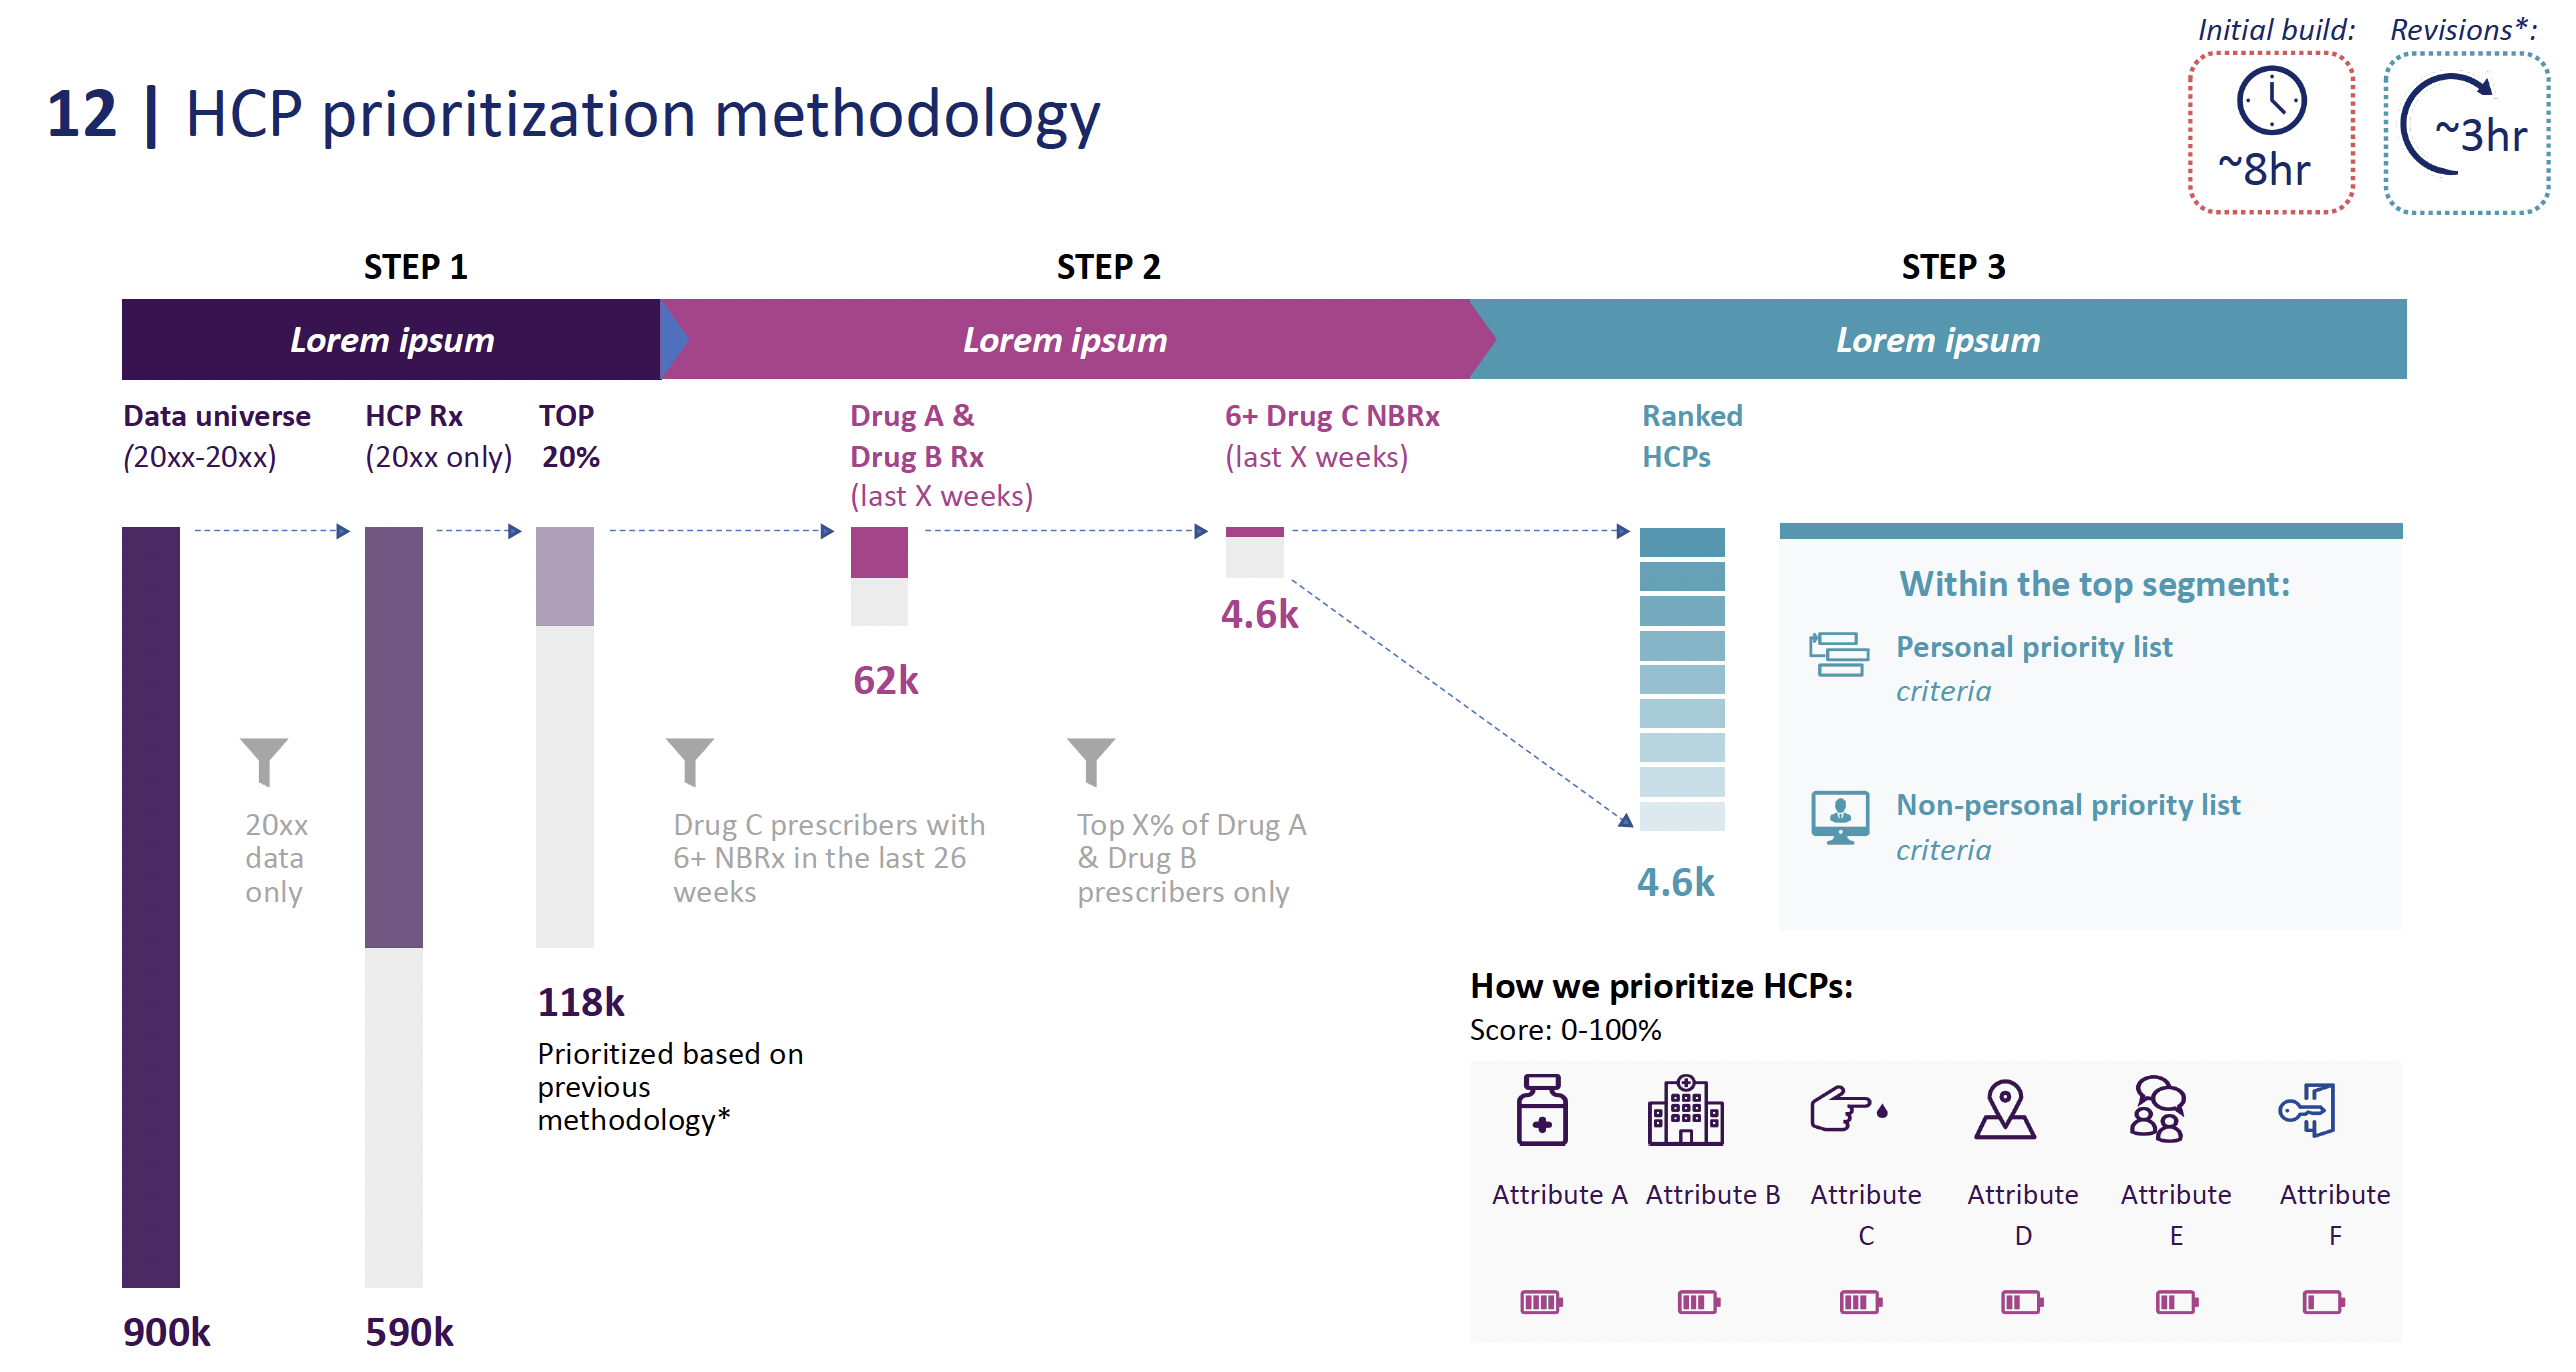
- Strategic Methodologies: Visualized complex HCP prioritization methodologies and market opportunity identification based on competitor consumption patterns.
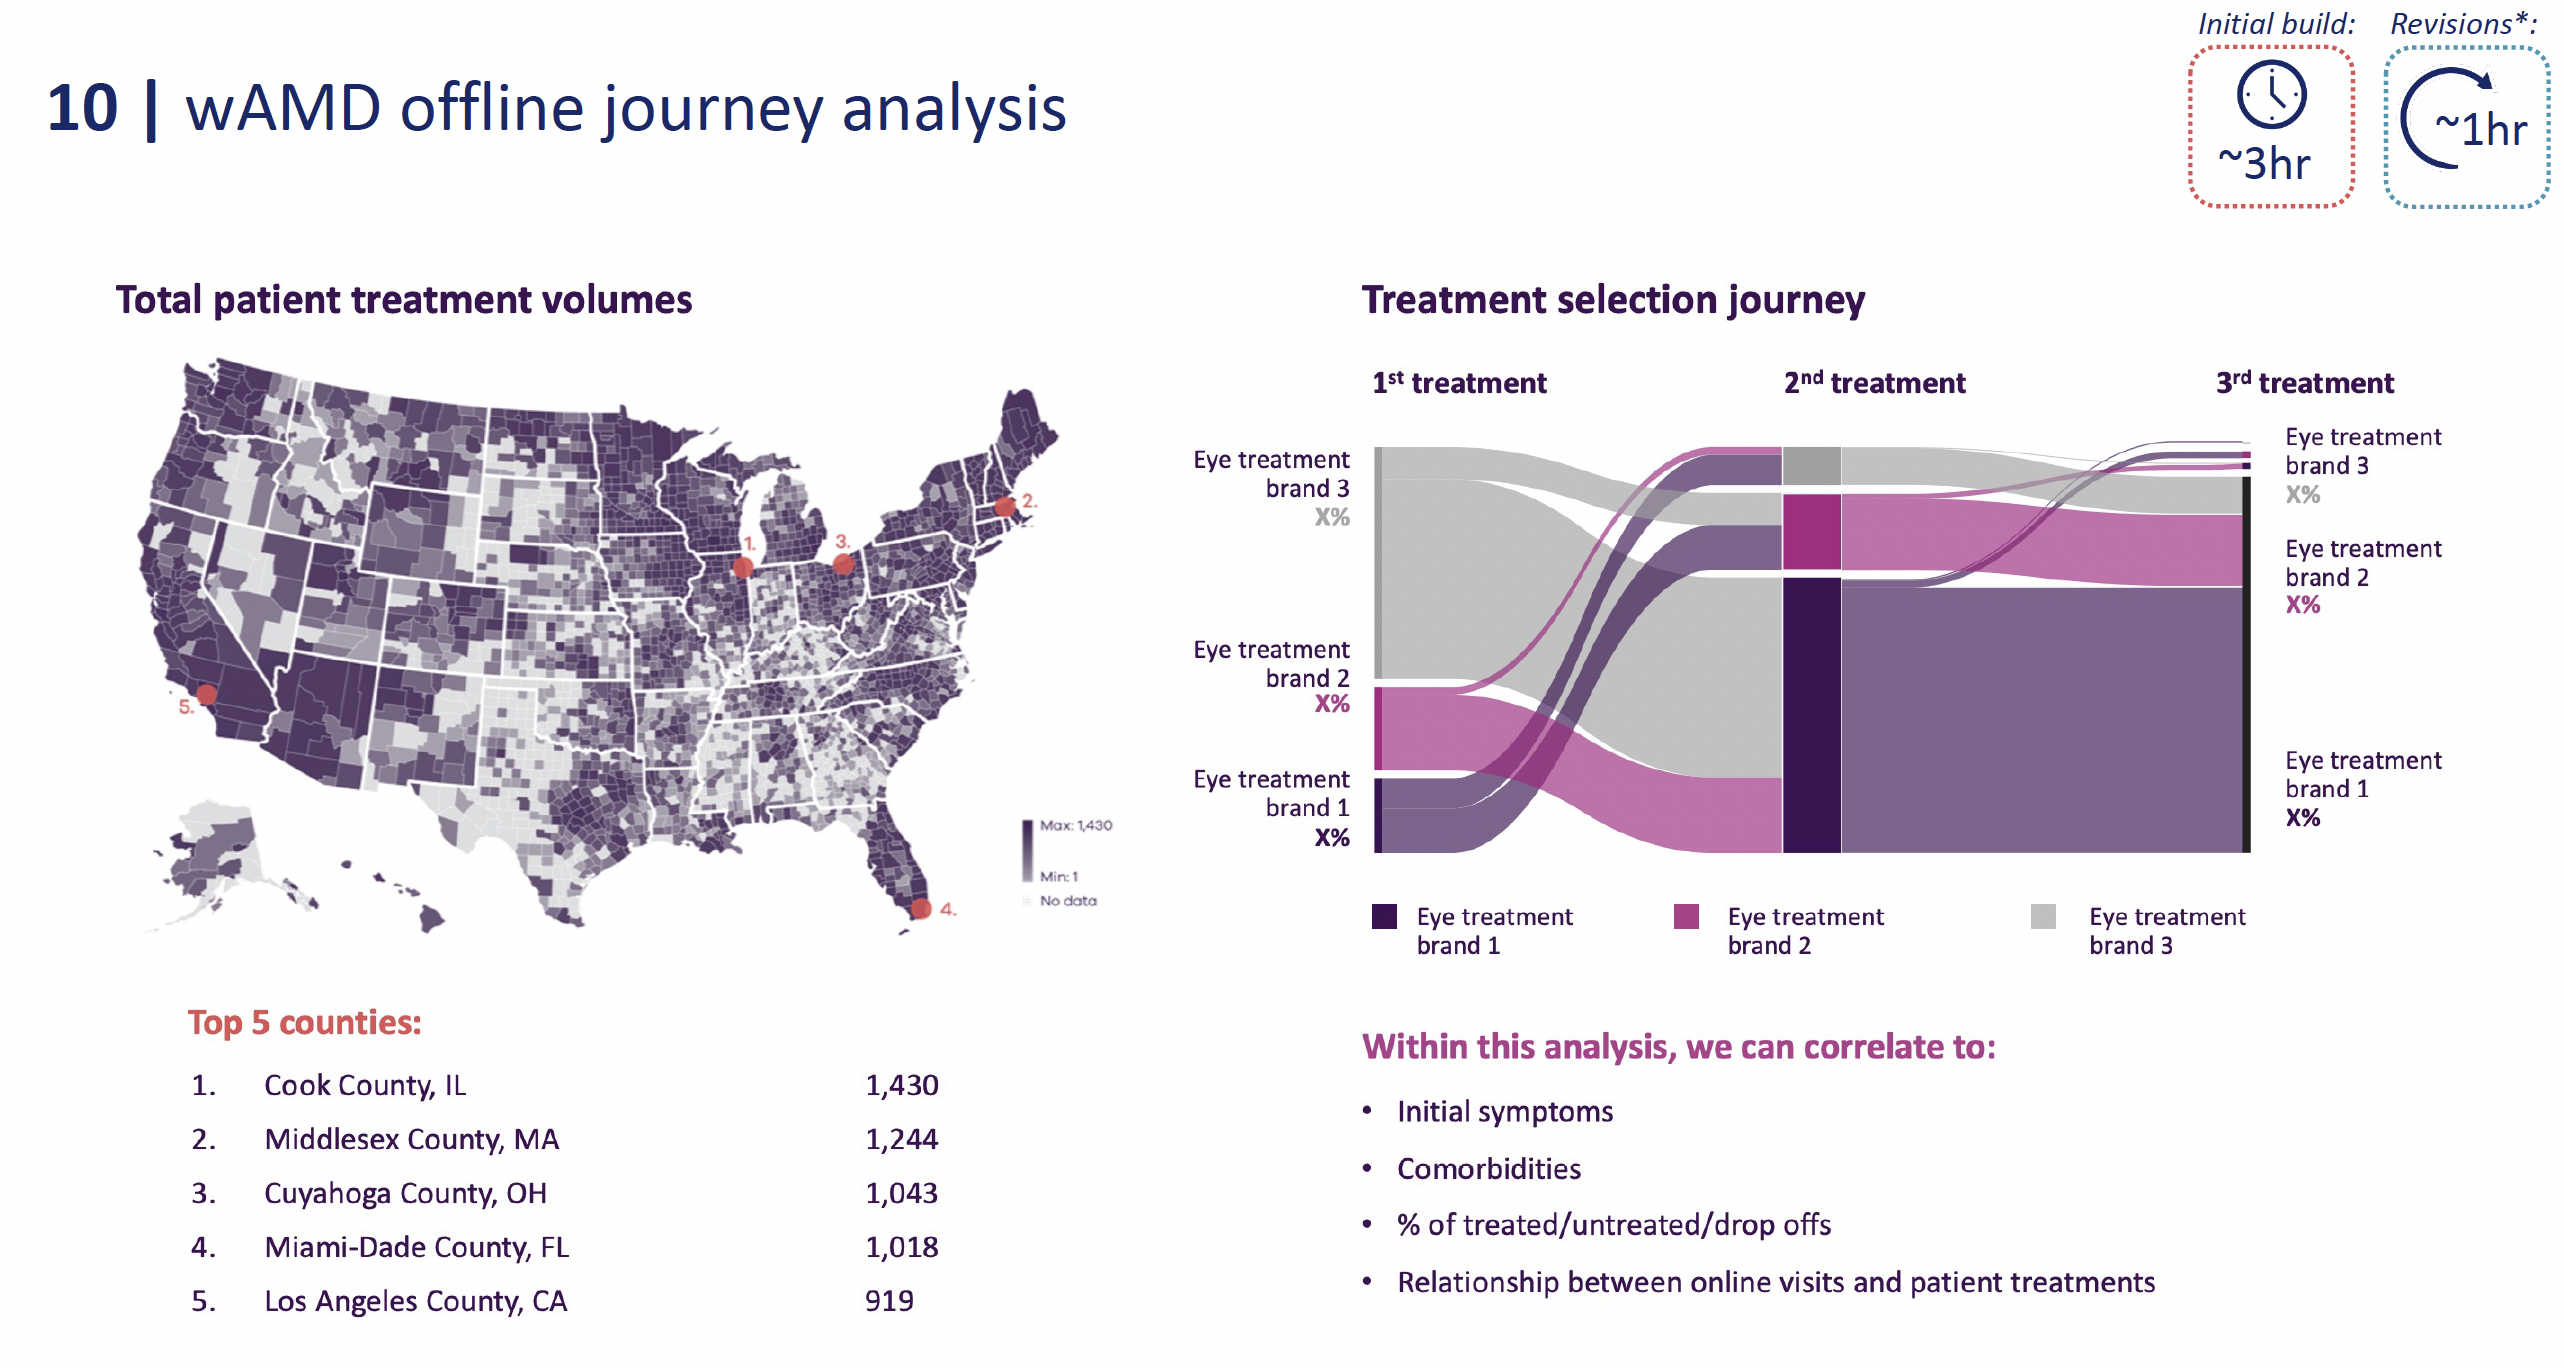
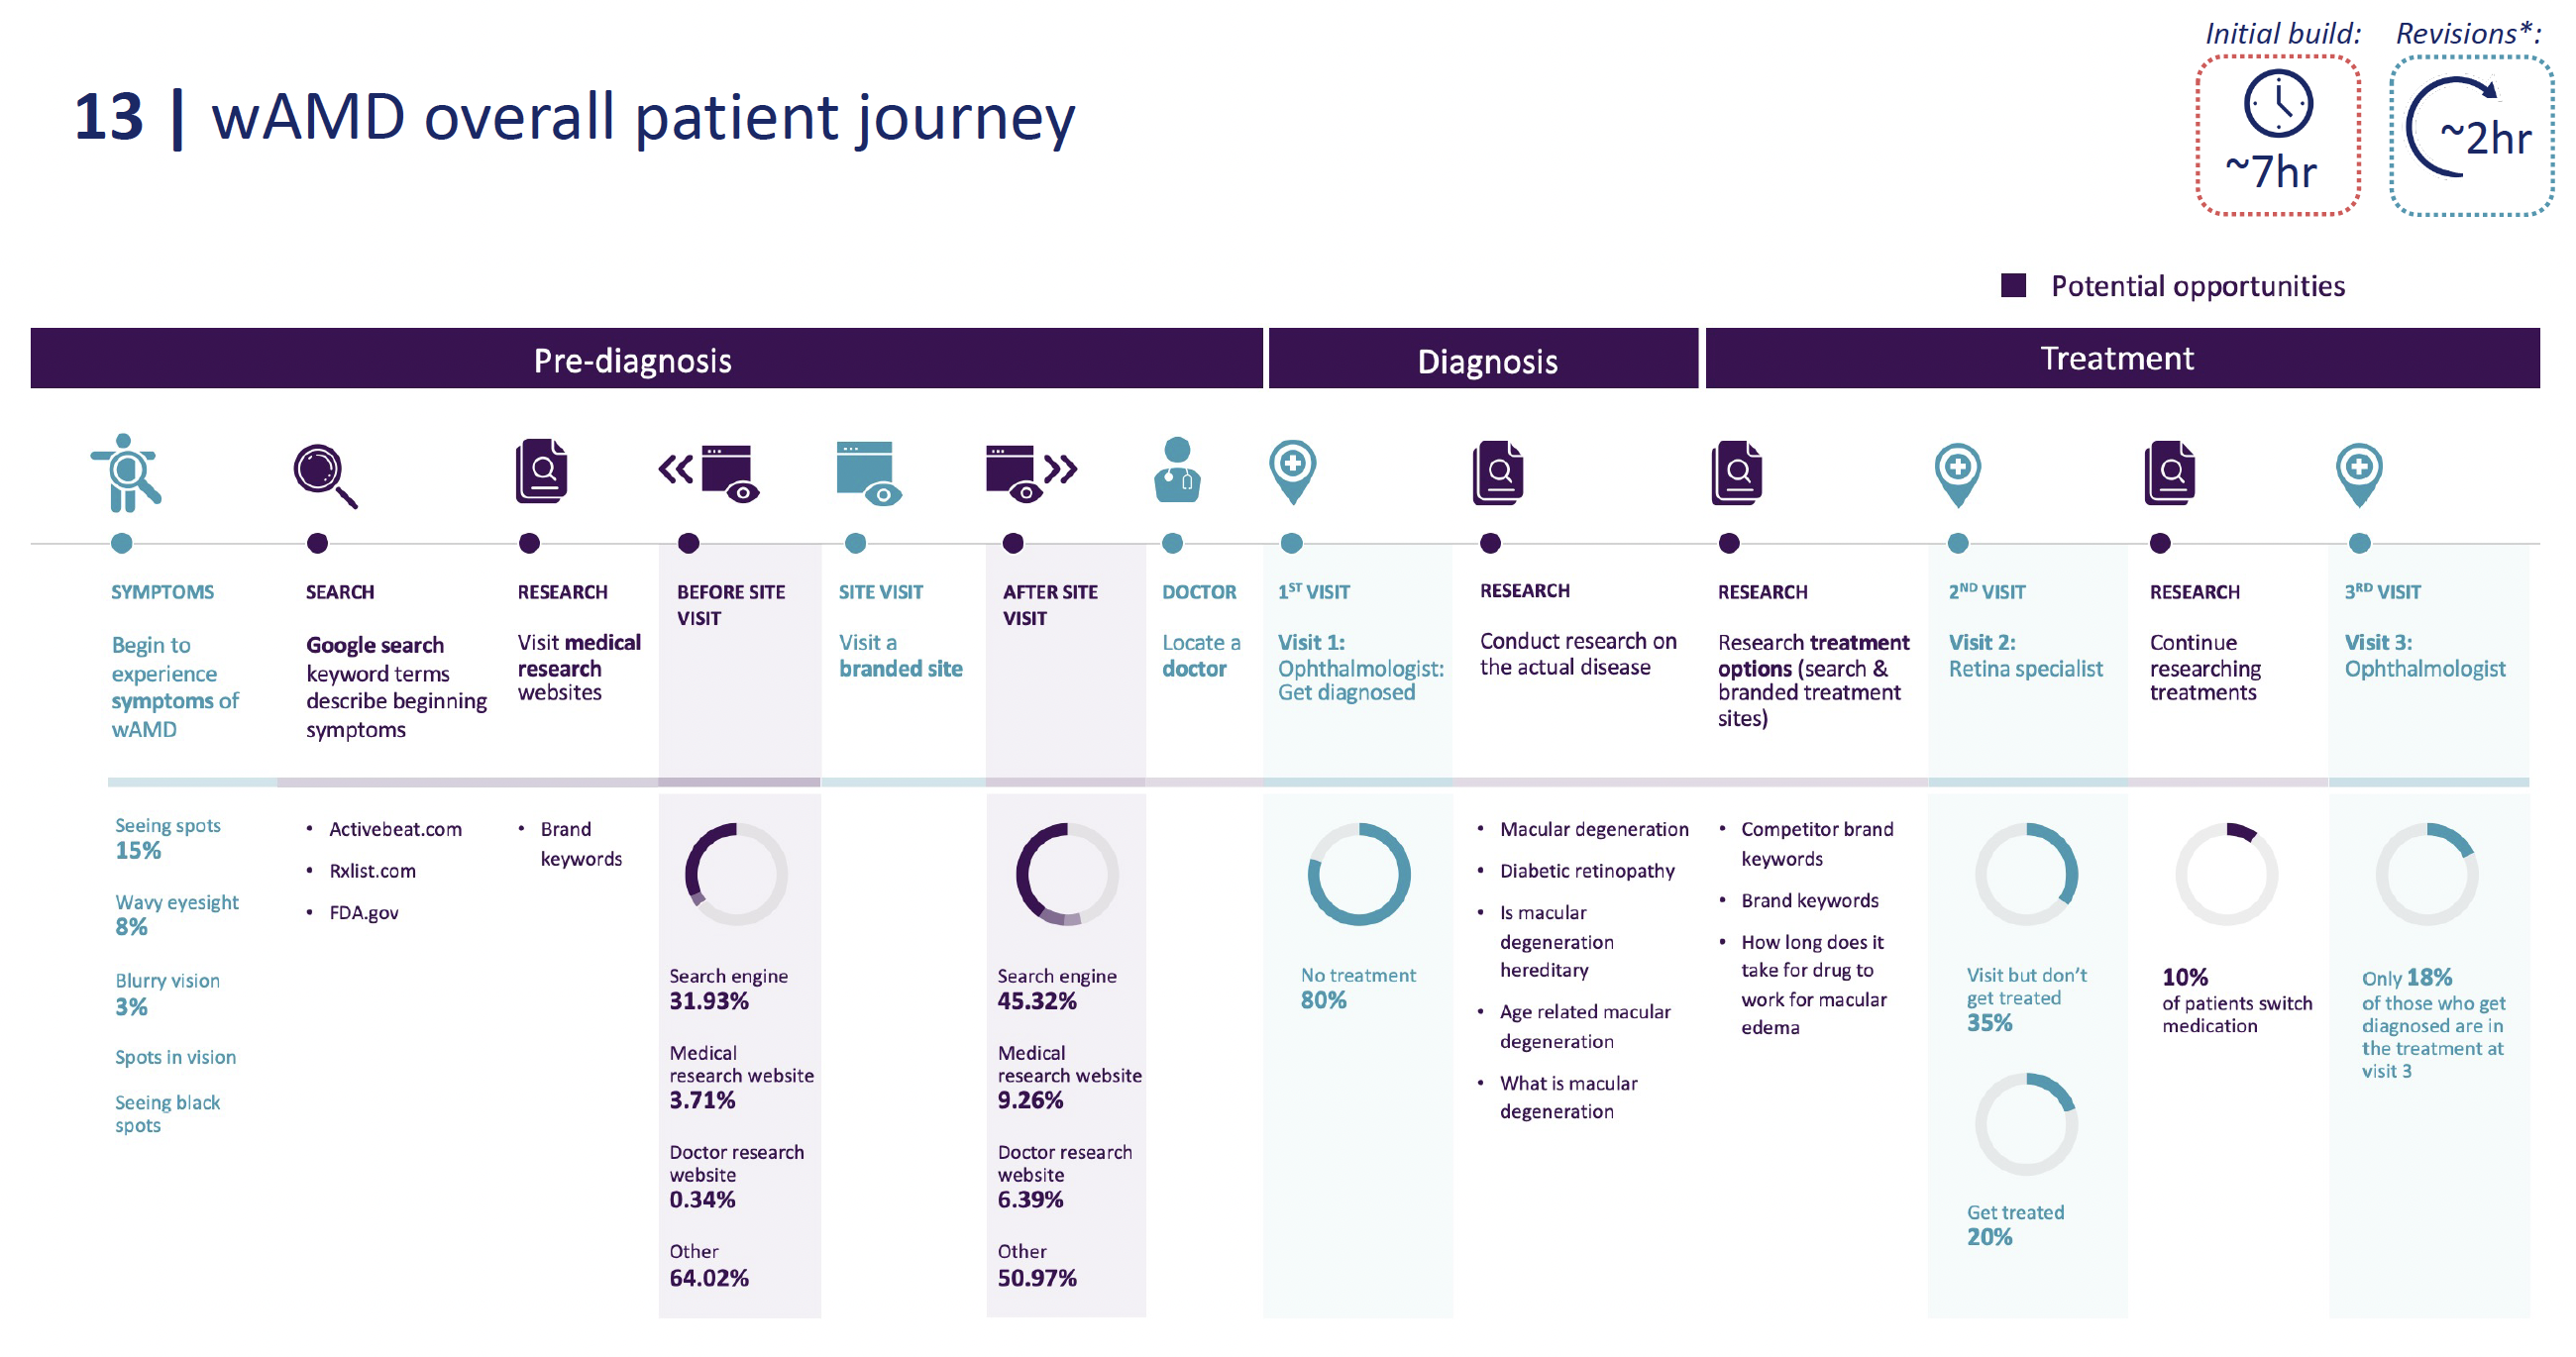
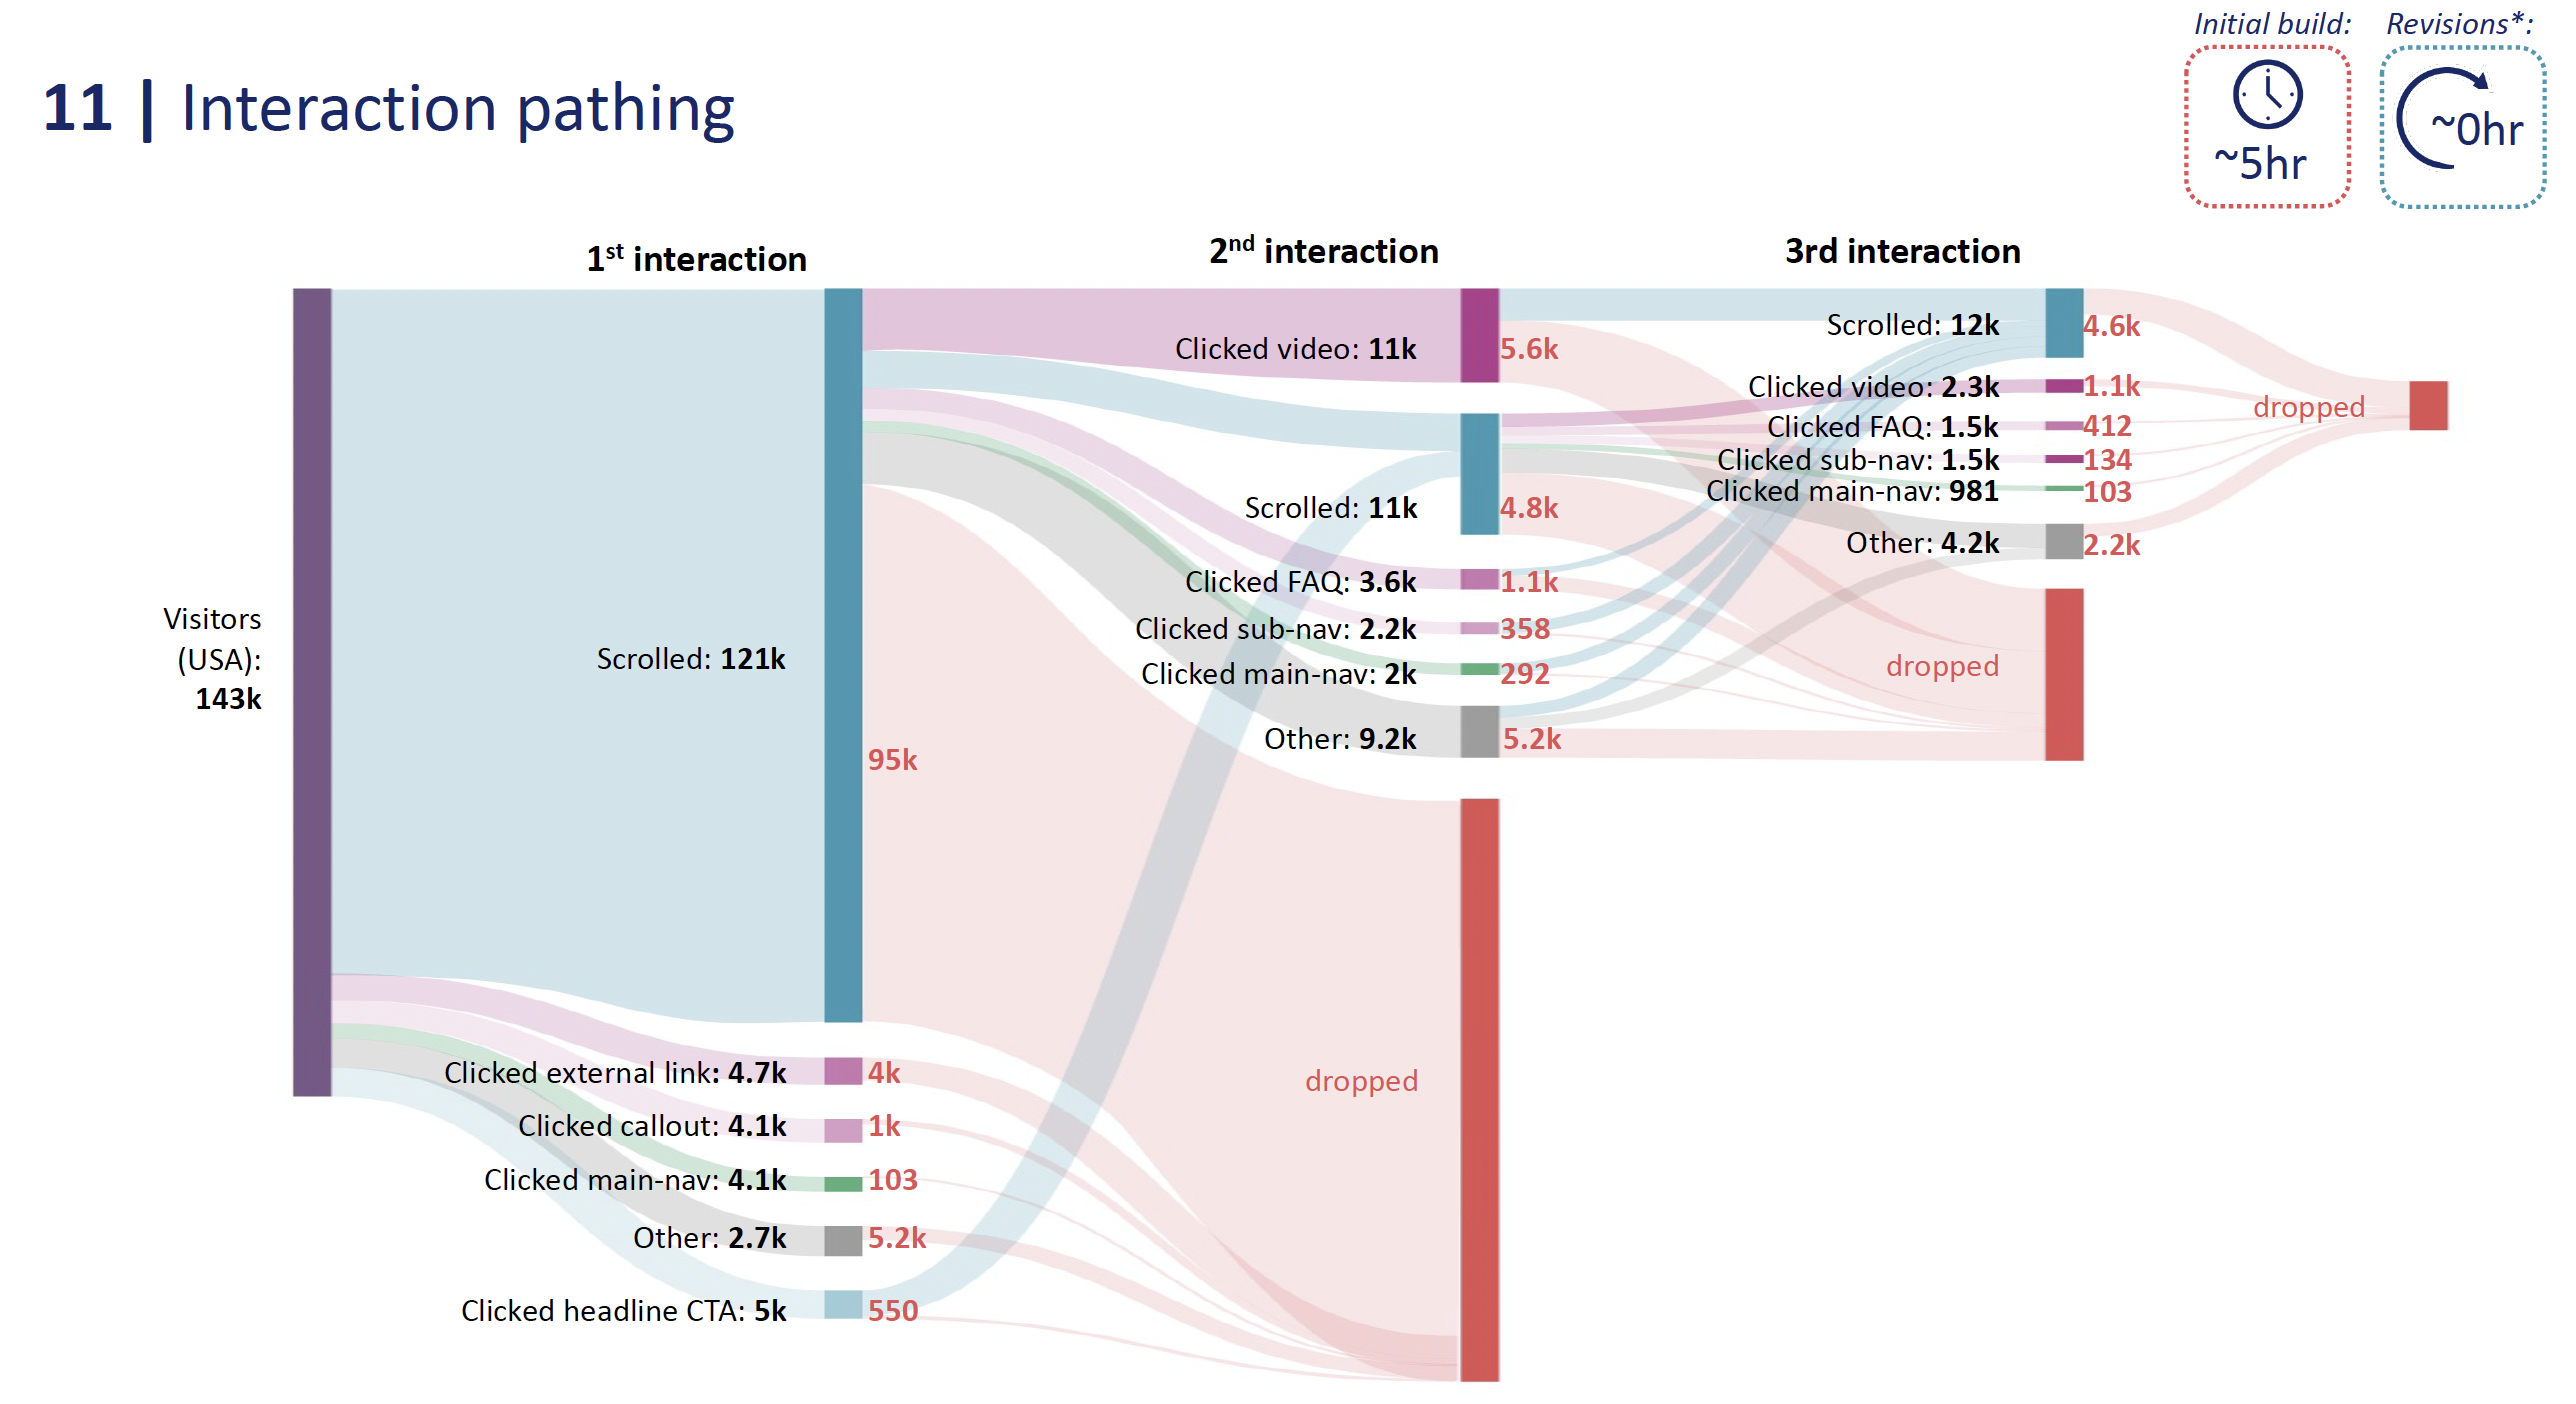
- Patient Journey Analysis: Mapped offline and online patient journeys for conditions like wAMD to identify key interaction paths and “dropped” visitor points.
- Consumer Insights: Designed dashboards representing demographics, salary, and media consumption habits (e.g., top social media and app usage).
05. Reporting & Dashboards
I developed a standardized process for recurring performance reports.
- Campaign Analytics: Visualized reporting data from Google Analytics and Power BI, highlighting critical differences from previous periods to make complex site metrics quickly digestible.
- HCP Profile Dashboards: Built comprehensive dashboards focused on baseline performance, over-indexing segments, and personality marketability.
06. Toolset & Collaboration
- Technical Proficiency: Expert use of Adobe Creative Suite (Illustrator, Photoshop, InDesign) for wireframing and mechanical file production, and PowerPoint for final client delivery.
- Cross-Functional Teamwork: Collaborated with Medical Teams, internal Marketing Science teams, and clients, often managing projects with up to 4 Full-Time Equivalents.
- Efficiency: Consistently delivered high-quality initial builds ranging from 1 to 175 hours, with dedicated cycles for ingesting internal and client feedback.