High-Precision Vehical Navigation System
Real-time Data Visualization · Industrial UI/UX · Systems Monitoring
01. Project Overview
This project involved the end-to-end design of a software interface for a sophisticated hardware sensor (IMU/GNSS). The sensor provides critical health, position, and attitude data for vehicles operating in extreme environments, including airborne, ground-based, and underwater crafts. The primary goal was to transform high-frequency raw bitstreams into a digestible, real-time visual dashboard for engineers and operators.
02. The Challenge: “Visualizing the Invisible”
Hardware sensors generate massive amounts of technical data (asynchronous IMU status, Health logs).
- Data Density: Presenting latitude, longitude, roll, pitch, and yaw alongside system health metrics without overwhelming the operator.
- Operational Context: The interface needed to support multiple view modes — graphical, text-based, and raw bitstream — to serve both high-level monitoring and deep-dive technical debugging.
- Criticality: In multi-domain navigation (air, sea, land), a split-second delay in interpreting “Health” or “Attitude” data can lead to mission failure.
03. Design Iterations & Evolution
The interface underwent several design cycles to move from a basic data-reader to a sophisticated cockpit-style dashboard.
Phase 1: Modular Wireframing
Initial designs focused on categorizing data into logical buckets: Position, Attitude, and Health.
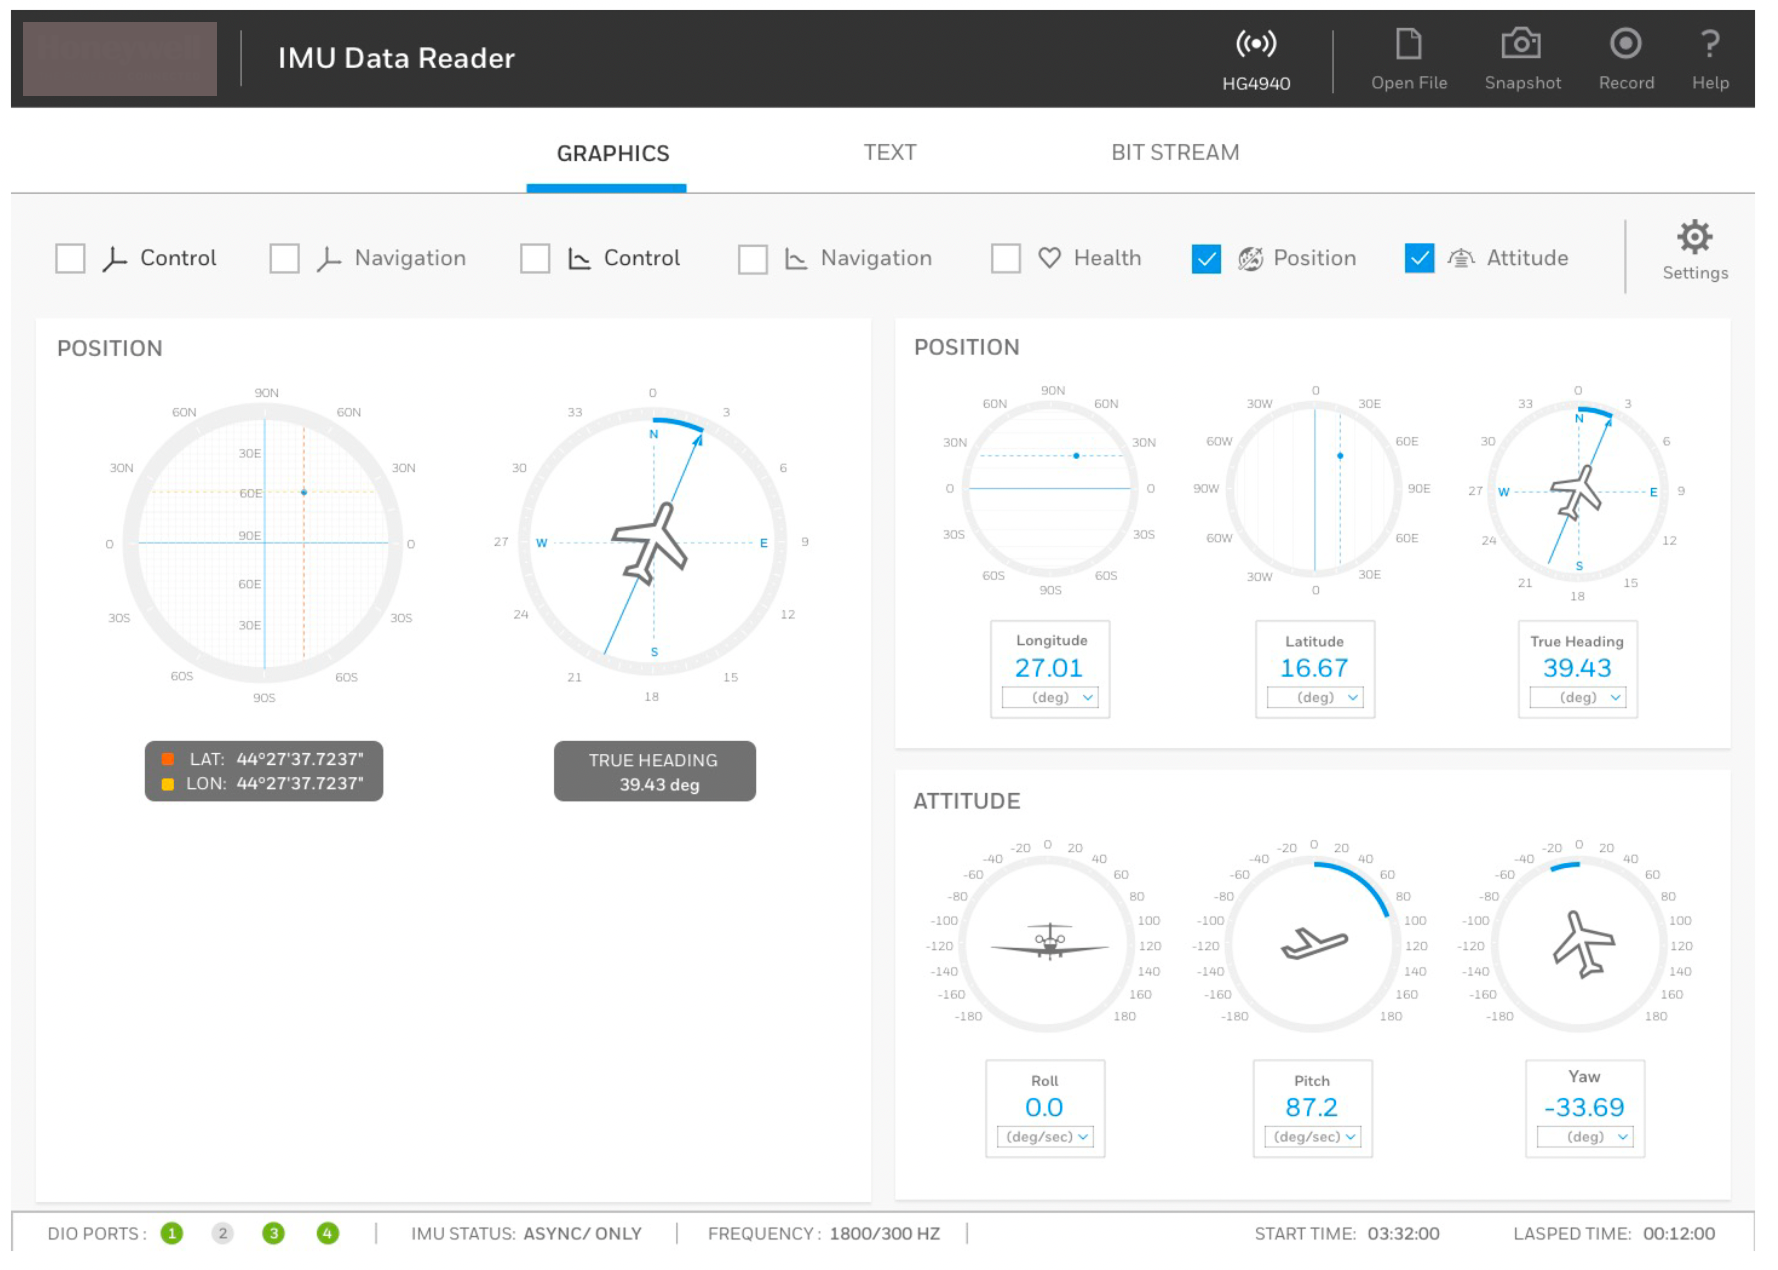
- Visual Strategy: Using “Gauge” and “Dial” metaphors to represent Roll, Pitch, and Yaw to mimic physical aviation instruments.
- Control Center: Establishing a persistent sidebar for primary controls to ensure key actions were always accessible.
Phase 2: Refined Data Hierarchy
Through iterative cycles, the layout was optimized to prioritize “System Health.”
- Color Logic: Transitioned to a “Traffic Light” system — Green for stable health, Yellow for warnings, and Red for critical failures in the IMU status.
- Frequency Tracking: Real-time visualization of frequency was integrated to ensure data integrity during high-speed vehicle maneuvers.
04. Key Interface Features
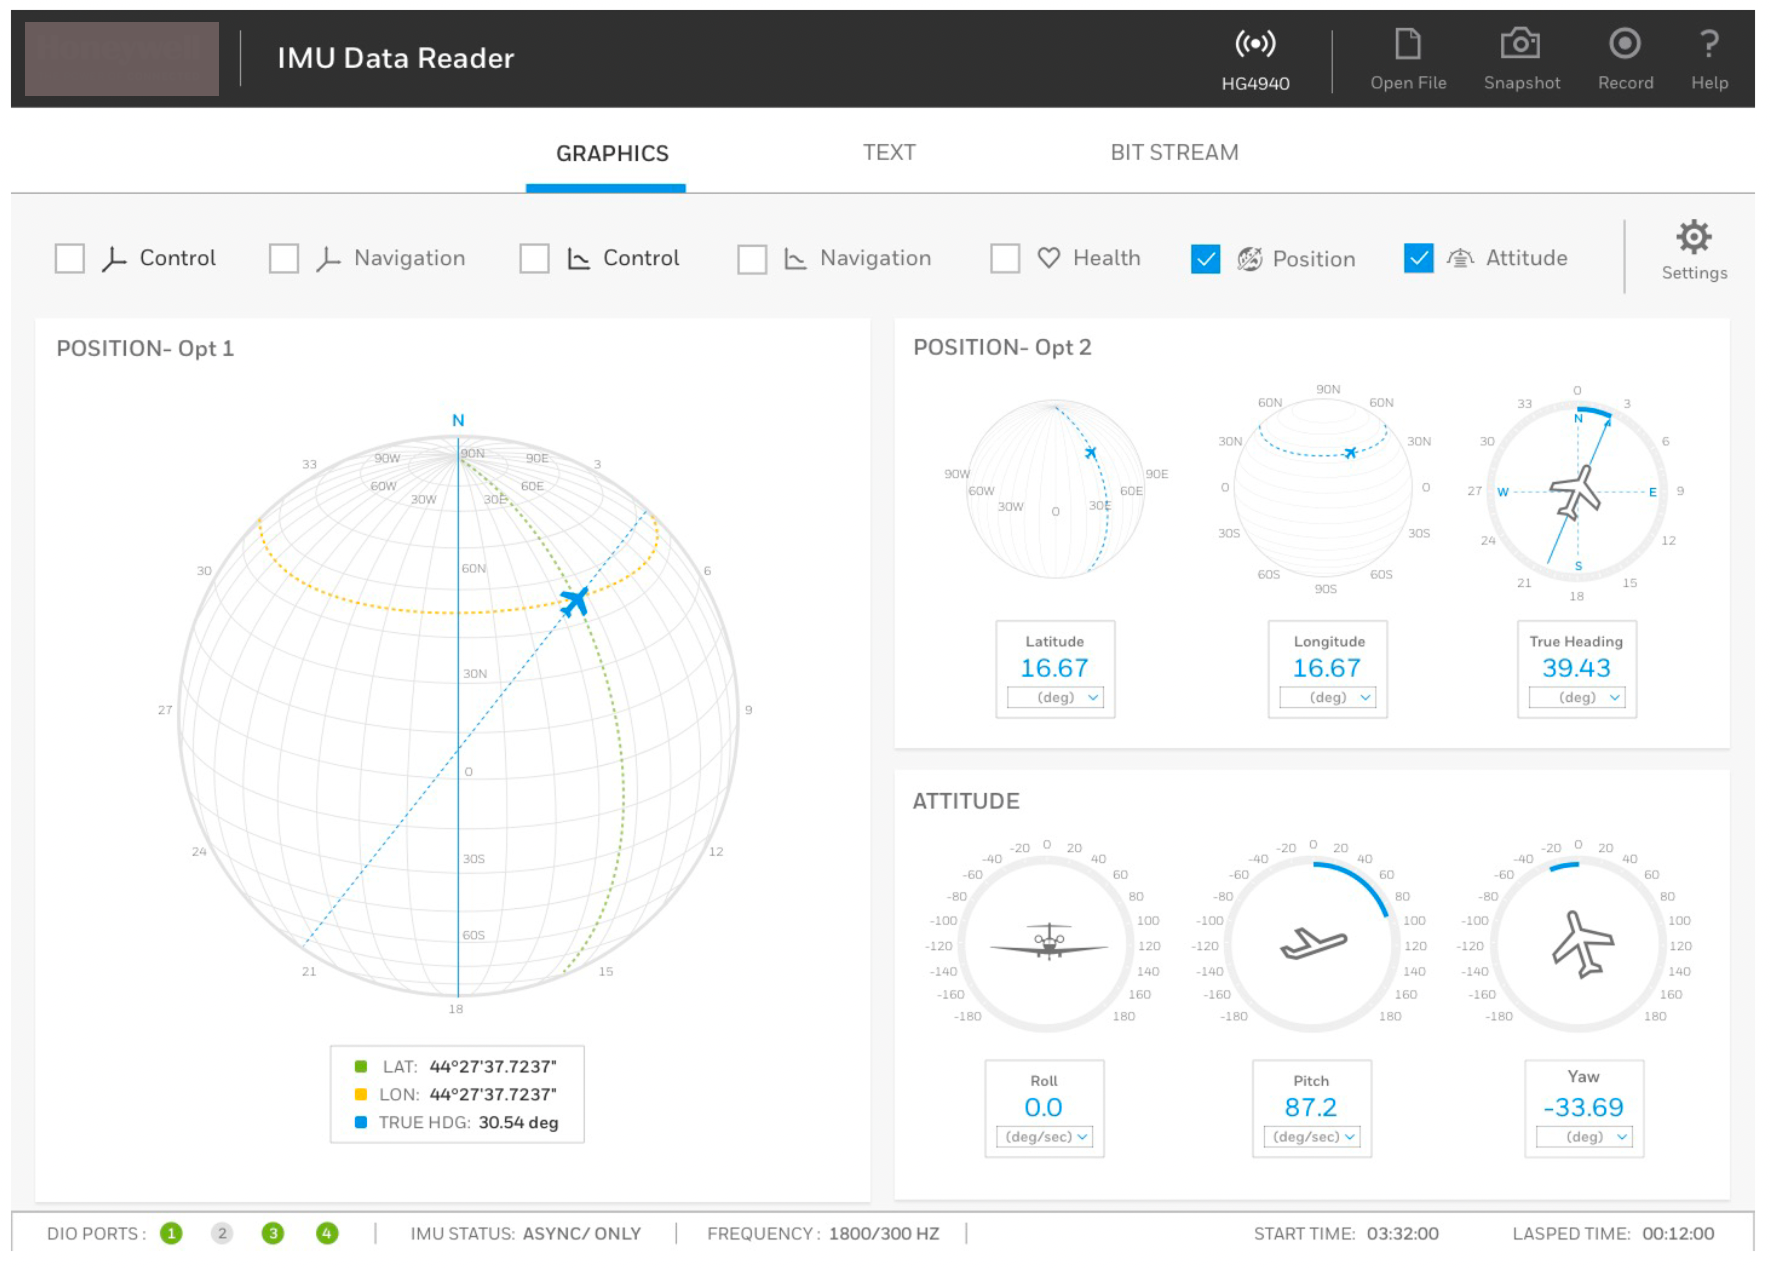
A. The Multi-Domain Dashboard
The final dashboard provides a unified view of the hardware’s performance:
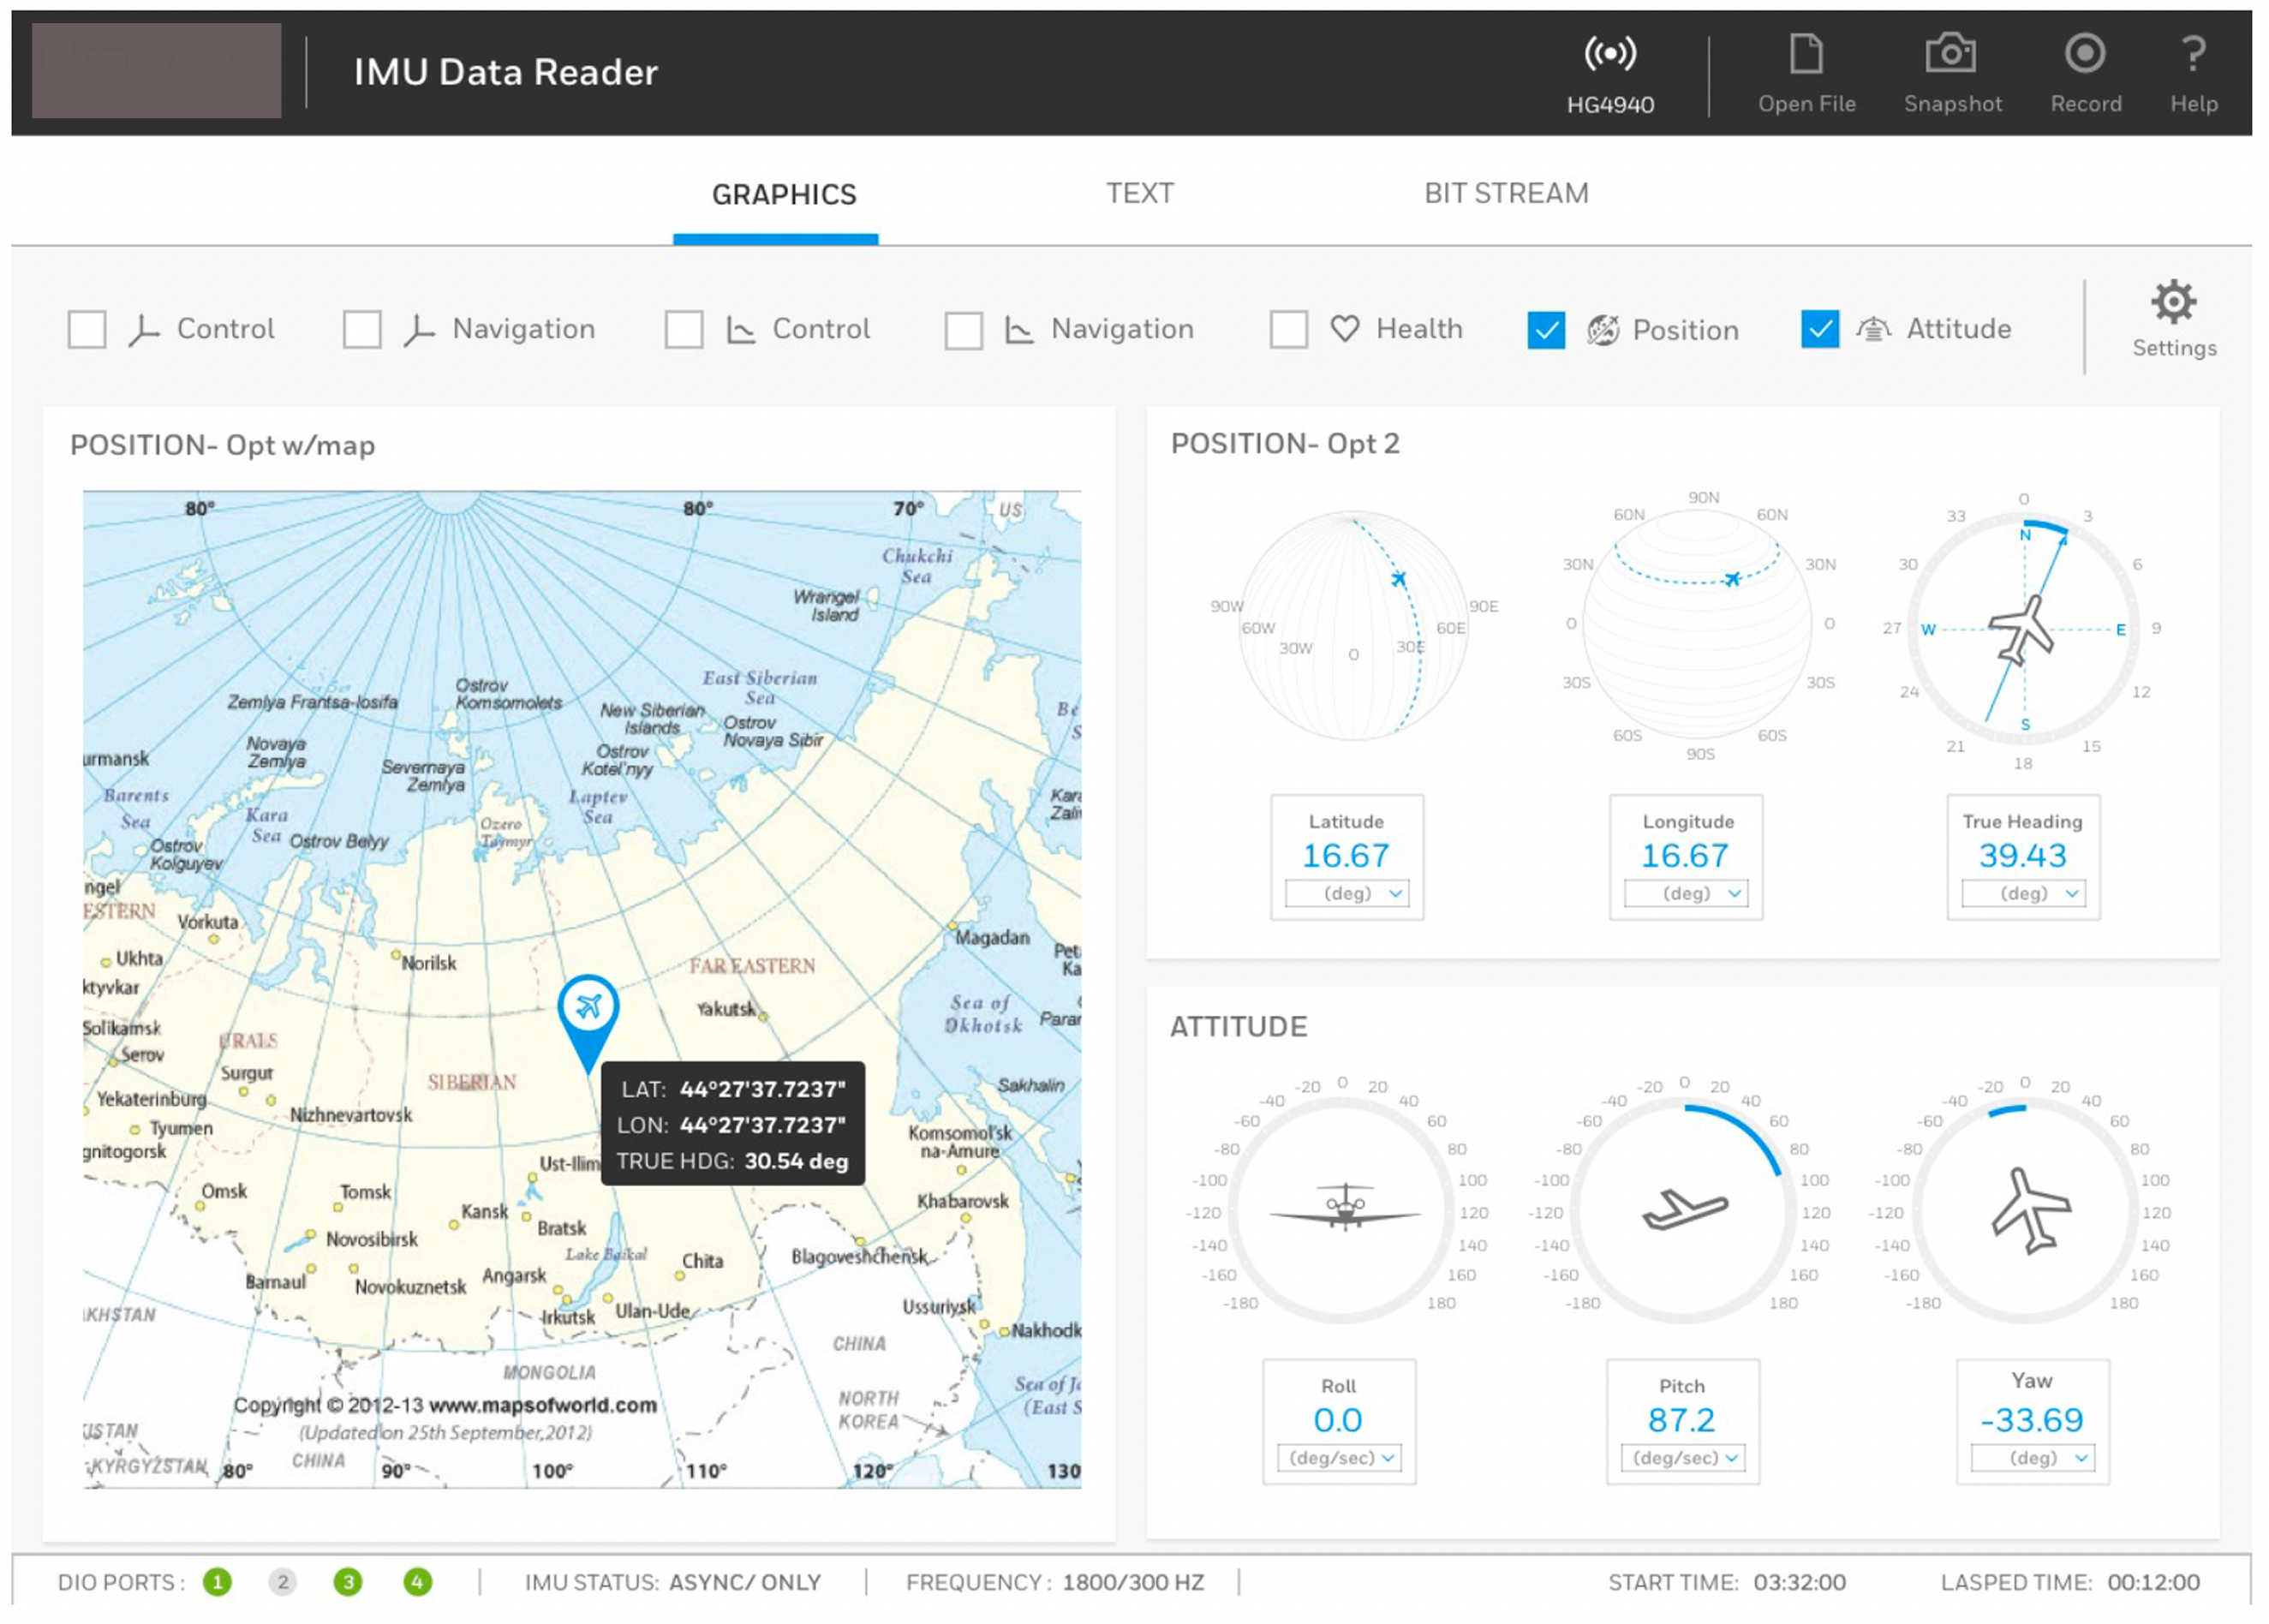
- Attitude Visualization: Real-time graphical representation of the vehicle’s orientation (Pitch, Roll, Yaw) using dynamic scales.
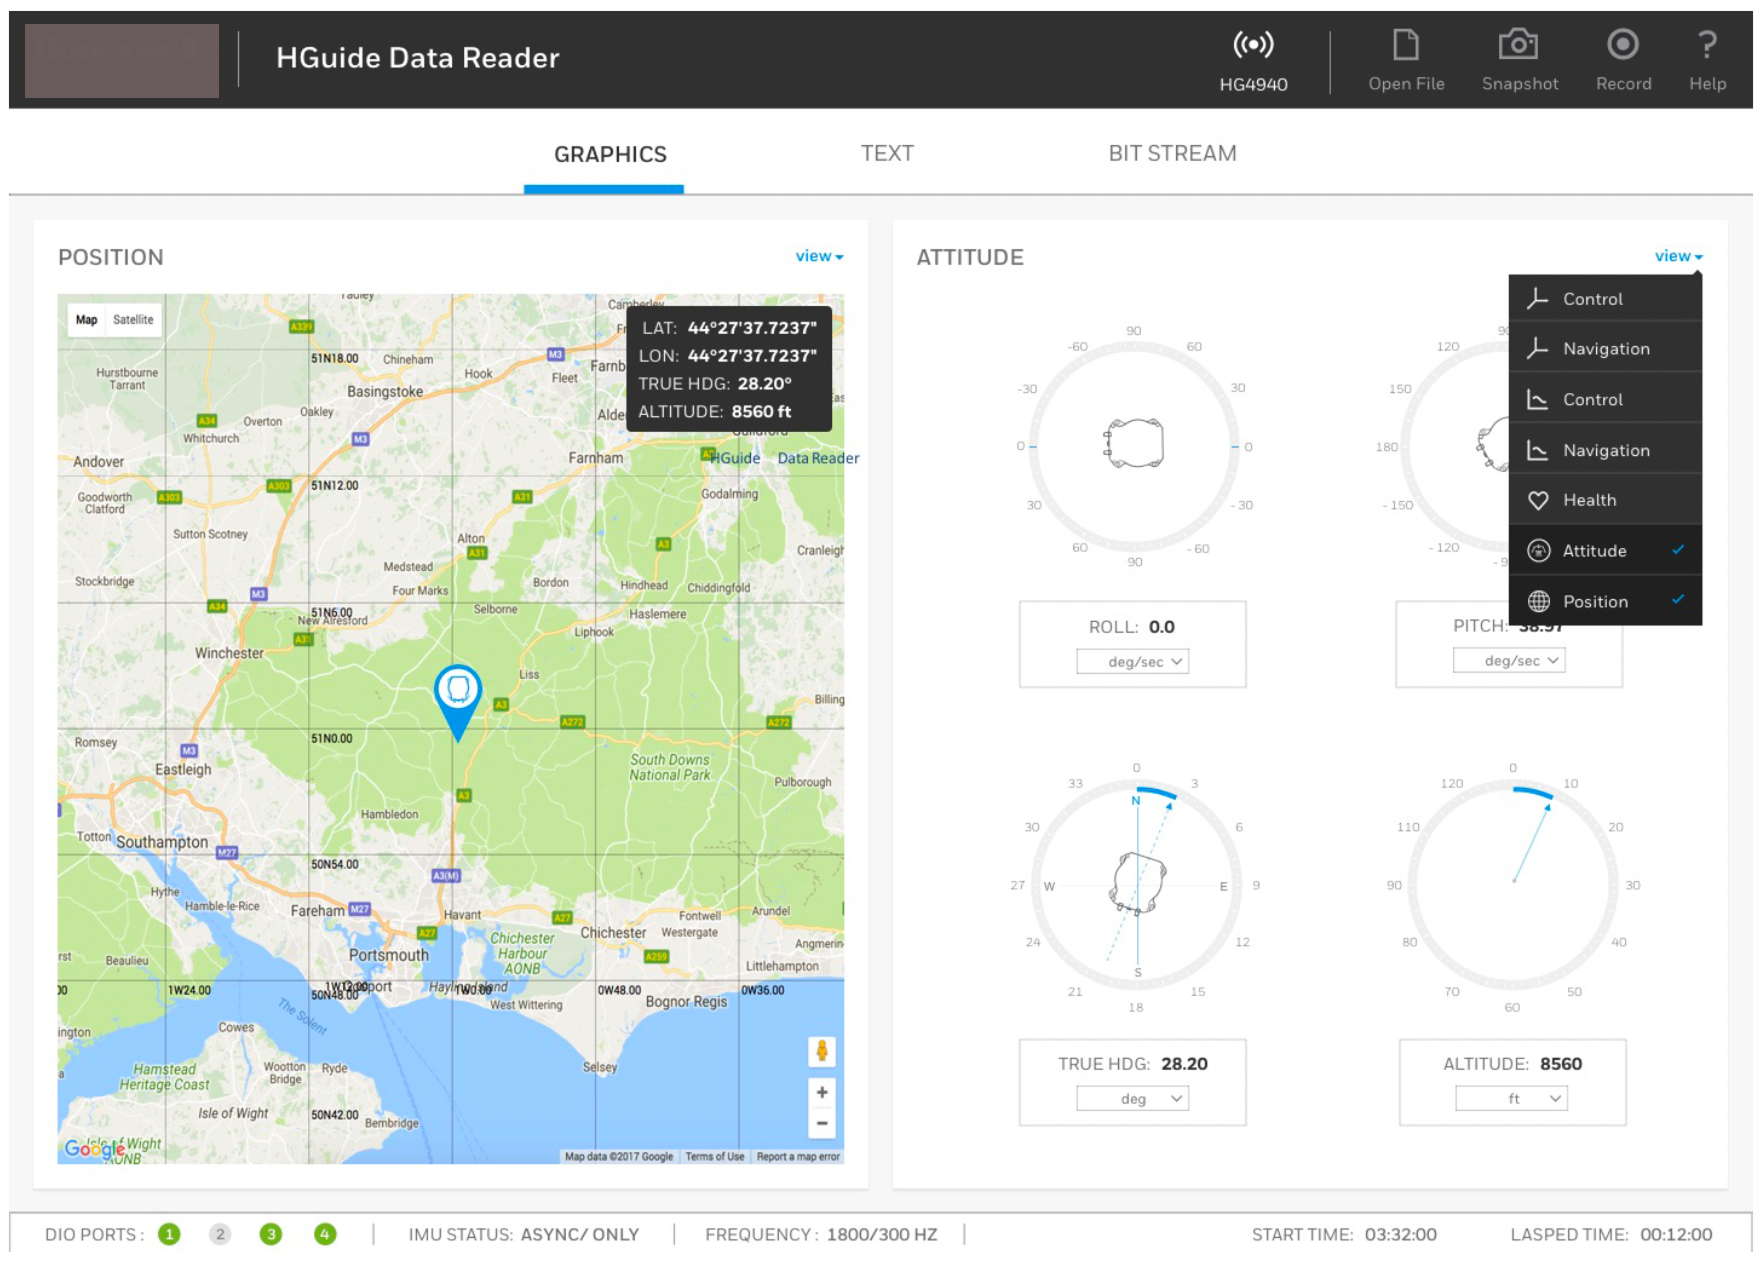
- GNSS Integration: Mapping latitude and longitude coordinates with high-precision decimal accuracy.
- Status Indicators: Monitoring DIO ports and ACN (Active Control Nodes) to ensure the hardware is communicating correctly with the vehicle’s onboard computer.
B. Interactive Graphing Engine
A dedicated ‘Graphics’ view was developed to allow operators to track variables over time.
- Feature: Synchronized scrolling of multi-variable graphs (e.g., comparing Pitch vs. Roll over a 60-second window).
- Benefit: This allows engineers to identify vibration patterns or drift in the hardware sensors during field testing.
C. Developer & Operator Toggle
The interface includes a “Bit Stream” and “Text” mode. This allows developers to see the raw hex/binary data coming off the hardware, while operators can stick to the “Graphics” view for intuitive monitoring.
05. Industrial UX Principles Applied
- Legibility in High-Stress Environments: Large, high-contrast typography was used for critical metrics (True Heading and Position) to ensure readability in varying lighting conditions.
- Iconography: Custom icons were designed for ‘Snapshot’ and ‘Record’ to facilitate easy data logging during live vehicle runs.
- Information Density: Utilizing a grid-based layout to pack over 20 unique data points into a single screen while maintaining white space to prevent cognitive fatigue.
06. Impact & Results
- Reduced Interpretation Time: Operators reported a significantly faster time-to-insight when diagnosing sensor drift compared to legacy text-only readers.
- Error Prevention: The visual “Health” indicators allowed for preemptive hardware maintenance before the vehicle entered a critical mission phase.
- Unified Tooling: By supporting airborne, ground, and sub-sea data profiles in one interface, the software became a universal diagnostic tool for the hardware line.