Work · FCB Health · Healthcare · Information design · 2022

Making Sense ofHealthcare Data

Clinical trial results and market data, redrawn as charts a doctor or a brand team can read at a glance.

0 to 3 hof changes after medical review on most slides.

The original slides. Click one to zoom.

The story in six lines

  1. GoalHelp pharma brand teams show trial results that doctors grasp in seconds.
  2. ProblemStandard charts hid the point. In one brand’s data, lung disease drove 116 of 198 doctor questions., go to this part
  3. ApproachOne message per chart, with the form chosen to do the explaining, sketched first., go to this part
  4. DecisionOne message per chart, with the other findings moved to backup slides., go to this part
  5. LaunchDelivered for kidney disease, ALS and breast cancer brands., go to this part
  6. ResultMost slides came back from medical review with 0 to 3 hours of changes., go to this part

Select a line to read that part.

At a glance

Role
Data visualization specialist
Team
Marketing Science
Readers
Doctors and pharma brand teams
Tools
Illustrator, PowerPoint, InDesign, Figma

01 · The problem

The job: one message per chart

Trial results, prescription data and web analytics, turned into slides a doctor reads in seconds.

  1. Clinical trial results

    Vision gains hold to week 96, in both trials.

    For doctors

  2. Prescription data

    Of 900k prescribers, 4.6k are worth a rep’s visit.

    For the brand team

  3. Web analytics

    Most of 143k visitors scroll once, then leave.

    For the campaign team

Each message is one of the charts further down this page.
steps from brief to final deck
7steps from brief to final deck
people at most on one build
4people at most on one build
hours for the largest initial build
175hours for the largest initial build
disease areas: kidney, eye, ALS and breast cancer
4disease areas: kidney, eye, ALS and breast cancer
  1. Principle 01

    Find the one message

    One question per slide.

  2. Principle 02

    Pick the form that carries it

    The form does the explaining.

  3. Principle 03

    Stay clinically exact

    Clearer, never bent.

Decisions behind it

Three calls that shaped it

  1. The call I made

    One message per chart

    One message per chart, the rest in backup slides, so a doctor gets the point in seconds.

    What it cost: Secondary findings live in backup slides.

  2. What I dropped

    The curve as it came

    The kidney disease curve hid its own point. I redrew it so the difference reads first.

  3. The constraint

    Accurate, never overstated

    Charts could clarify a result, never round it up.

02 · Kidney disease

The brief: kidney disease, and a curve that hid its point

Solid data, but the standard charts made doctors work to see it.

Disease
Chronic kidney disease, with type 2 diabetes
Deliverable
Illustrator wireframes for a whitepaper visual aid
Team
4 people
Time
~30 hr to build, ~25 hr to revise

Before you read on

Can you see what Product X did?

The result as it arrived. Can you find the benefit?

The standard curve

0%10%20%30%06121824303642MonthsProduct XPlacebo
Curve shapes SIMULATED; the 20% reduction is from the original slide.

Every line of the brief, answered

Each objective, its sketch and its final.

  1. In the brief · 01

    Convey the threat of untreated kidney disease

    One scale, with the 80% ringed so the risk reads first.

    Pencil
    Patients with UACR (mg/g)03030003030080%more likely to dieof a CV event
    Final, rebuilt
    Normal UACRHigh030300UACR, mg/g80%Patients withhigh UACR aremore likely to diefrom a CV event
  2. In the brief · 02

    Show how unusual the studied patients were

    A grid doctors know, with the studied cells shaded.

    Pencil
    Final recommendation• background white, shade by riskG1G2G3aG3bG4G5A1A2A3lightercolor shadedarkeralbuminuria categories** for the patient population, keep thebackground light and highlight the overlap
    Final, rebuilt
    A10–29A230–299A3300–3,499A3≥3,500G1>90G260–89G3a45–59G3b30–44G415–29G5<15OUR PATIENTSAlbuminuria, mg/gGFR stage, ml/min/1.73 m², falling to the right
  3. In the brief · 03

    Find an alternative to the standard KM curve

    The gap shaded and the 20% named.

    Pencil
    Secondary Endpoint• CV eventsProduct XPlacebo0100Patients with an event (%)20%reductionin CV eventsmonths since randomization →
    Final, rebuilt
    0%10%20%30%06121824303642Months20%relative riskreductionProduct XPlacebo
  4. In the brief · 04

    Accentuate the dosing journey: the starting dose

    A step chart on the axis doctors check first.

    Pencil
    DOSAGE:Product X: the starting dose10 mg/day20 mg/day02560100for the patients with an eGFR(ml/min/1.73 m²)1020dose10 mg/day20 mg/day02560100for the patients with an eGFR →
    Final, rebuilt
    1020Dose, mg/day02560>60eGFR, ml/min/1.73 m²10 mg/day20 mg/dayno start
  5. In the brief · 05

    Accentuate the dosing journey: titration over time

    Dots sized by dose show each step.

    Pencil
    TITRATIONDOWN TITRATIONpermitted anytimeafter start oftreatment20mg/day10mg/dayUP-TITRATIONpermitted anytimeafter visit 210mg/day20mg/dayRun-invisitScreeningvisitVisit1Visit 2(Month 1)Visit 3(months)Visit nevery 4 monthstill study endEnd ofstudy visitPosttreatmentfollow up
    Final, rebuilt
    Day 0first doseDay 14 to 16 wkscreeningMonth 1visit 2Month 4visit 3Month 8visit 4Every 4 moto the endEndof studyDOWN TITRATIONany time after the start of treatmentUP TITRATIONany time after month 110 mg20 mg

03 · Breast cancer

Breast cancer: where doctors' questions piled up

Six months of doctors' questions arrived as spreadsheets. The team needed to see where they fell short.

Disease
HER2 positive metastatic breast cancer
Deliverable
A PowerPoint deck of 3 core visuals, some with layout options
Team
3 people
Time
~38 hr to build, ~7 hr to revise

What the visuals had to do

  1. Reveal where doctors needed more from the brand, using their own questions
  2. Track how well that need was met, month by month
  3. Show which topics made up the questions about each side effect

One data set, three ways in

One view for each question the team would ask.

Lung disease drove 116 of 198 questions.

  • Interstitial lung disease
  • Heart function (LVEF)
  • Nausea and vomiting
  • Neutropenia
  • Hair loss (alopecia)
Counts from the original slides, January to June.

04 · ALS

ALS: a points scale, told as people

A bold rethink of ALS trial visuals: make every lost point read as something a patient can no longer do.

Disease
Amyotrophic lateral sclerosis (ALS)
Deliverable
A PowerPoint deck of 4 core visuals, with layout options
Team
4 people
Time
~175 hr to build, ~25 hr to revise

What the visuals had to do

  1. Humanize the data and invite empathy, a break from the purely clinical approach
  2. Create urgency, since time matters in ALS treatment
  3. Give every visual stopping power, so it reads at a glance
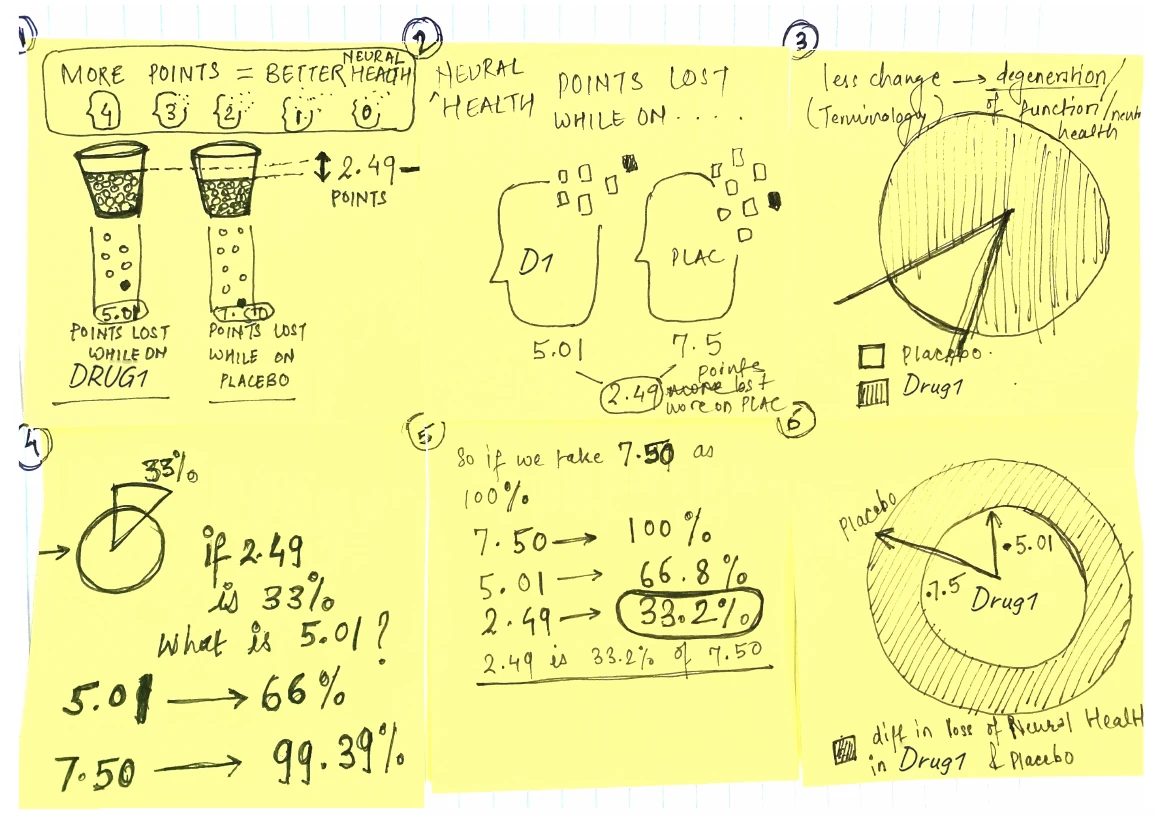
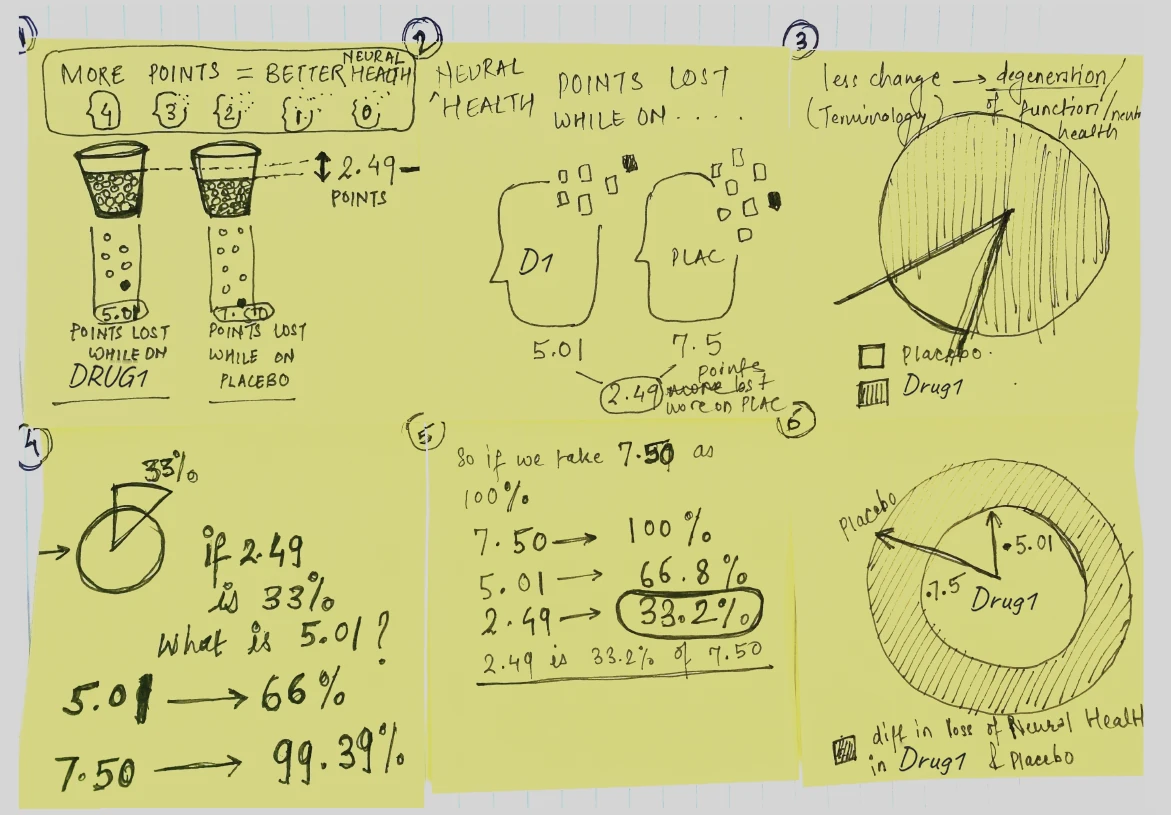
Six sticky notes of sketches: two cups of points, two heads losing pieces, pie charts, and the working that turns 2.49 points into 33%.
Sketches working out how to say 2.49 points.

Patients on the drug kept more of what they could do.

0−2−4−6−8Points lost by 24 weeks−7.50Placebo−5.01Drug12.49 points kepta third less decline than on placebo
Mean change on the ALSFRS-R scale at 24 weeks, from the original slides.

Every patient, one dot

Averages hide people, so every patient got a dot.

Drug169 patientsPlacebo68 patientsLost 2 or fewerpoints39.1%13.2%Lost 3 to 10points53.6%63.2%Lost 11 or morepoints7.2%23.5%
Counts and shares from the original slides.
  • 3×as many patients on Drug1 lost 2 points or fewer: 39.1% against 13.2%
  • 3×less likely, on Drug1, to lose 11 points or more: 7.2% against 23.5%

05 · The charts

Five slides, rebuilt so they draw themselves

Original slides, rebuilt to play.

01 · Targeting

From 900k prescribers to a ranked list

Every prescriber narrowed to the 4.6k worth a visit.

Why this form

True scale bars make each cut feel its size.

Built in ~8 hrRevised in ~3 hr

Step 1 · Narrow the universeStep 2 · Find the prescribersStep 3 · Rank themData universe(20xx to 20xx)900kHCP Rx(20xx only)590kTop 20%of prescribers118kDrug A & B Rx(last X weeks)62k6+ Drug C NBRx(last X weeks)4.6k20xx dataonlyDrug C prescriberswith 6+ NBRx inthe last 26 weeksTop X% ofDrug A & BprescribersRanked HCPsin ten deciles4.6k

How each HCP is scored, 0 to 100%

  • Attribute A
  • Attribute B
  • Attribute C
  • Attribute D
  • Attribute E
  • Attribute F
Counts from the original slide; drug names are its placeholders.

02 · Web analytics

Where 143k visitors went

Every path through a brand site, three clicks deep.

Why this form

Volume and order in one picture: most visitors scroll once and leave.

Built in ~5 hrRevised in ~0 hr

  • 0kvisitors landed on the site
  • 0kleft after one interaction: 73%
  • 0kmade a second click
  • 0kmade a third

Each figure is sized to its count.

1st interaction2nd interaction3rd interactionScrolled 121kHeadline CTA 5kExternal link 4.7kCallout 4.1kMain nav 4.1kOther 4.1kVideo 11kScrolled 11kFAQ 3.6kNavigation 4.2kOther 9.2kDropped 104kScrolled 6.6kVideo 2.3kFAQ 1.5kNavigation 2.5kOther 4.2kDropped 22k0kvisitors (USA)
Rounded and SIMULATED in the shape of the original, so the flows add up.

03 · Clinical efficacy

Two trials, one week axis

Vision change for two drugs over 96 weeks.

Why this form

One shared axis compares both trials at a glance.

Built in ~8 hrRevised in ~2 hr

Hover to read any week. Lines read off the original slide, so values are approximate.

04 · Study design

A protocol as a calendar

Doses, checks and interval changes over time.

Why this form

A protocol table becomes a clinic rhythm.

Built in ~12 hrRevised in ~3 hr

Matched phaseMaintenance phase: Drug1 every 12 or 8 weeks, Drug2 every 804812161st DAA2024283236404448Primary endpoint525660646872768084889296End of studyWeeks from the first dose
Schedule from the original slide.

05 · Patient journey

Where wet AMD patients fall away

From first symptoms to a third specialist visit.

Why this form

80% leave the first visit untreated. That gap is the opportunity.

Built in ~7 hrRevised in ~2 hr

Pre diagnosisDiagnosisTreatmentSymptomsSearchResearchBefore siteSite visitAfter siteDoctor1st visitResearchResearch2nd visitResearch3rd visit31.9%came from asearch engine45.3%left for asearch engine80%no treatmentafter visit 135%visit, untreated;20% treated10%switchmedication18%still treatedat visit 3Share of patients at each step, from the original analysis
Shares from the original slide.

06 · More of the work

One slide, one idea, and reports that lead with what changed

Turn a paragraph into a picture. Most took 1 to 15 hours.

A poster in light and dark

An outbreak poster from February 2020, in light and dark.

Built in ~18 hrRevised in ~5 hr

Reports that lead with what changed

Campaign reports that lead with what moved.

Sources
Google Analytics, Power BI
Cadence
Weekly, monthly, quarterly
Made in
Figma, exported as PDFs
Team
1 person
Time
~8 hr to build, ~2 hr to revise

Open any report to zoom into its numbers.

07 · Dashboards

Dashboards: who to reach, and where to find them

One page per audience, so a brand team can pick who to reach and which media to buy.

Three doctor segments, side by side

Every card answers the same questions in the same place: who they are, which media reach them, and which tests they order.

Matching layouts make the gaps between segments easy to spot.

Built in ~9 hrRevised in ~3 hr

A doctor profile, rebuilt

Who a brand should reach, scored against the average doctor.

Bars past the red line are where the brand should lean in.

How reachable they arePatient population167Practice size141Prescription volume177Receptive to reps79Loyal to competitors87100 = averageWhat motivates themHumility153Independence141Creativity127Influence126Tradition123100 = average
Index values from a sample dashboard.

08 · Outcome

Most slides came back with 0 to 3 hours of changes

Across these eight slides: 78 hours to build and 36 to revise, sketch first every time.

  • The brief: kidney disease visual aid30 hr + 25 hr
  • Trial design: eligibility12 hr + 3 hr
  • Trial design: vision results8 hr + 2 hr
  • HCP prioritization8 hr + 3 hr
  • wAMD patient journey7 hr + 2 hr
  • Interaction pathing5 hr + 0 hr
  • Methodologies5 hr + 0 hr
  • wAMD offline journey3 hr + 1 hr

Initial buildRevisions

The kidney disease aid took longest.

Most of the others came back with 0 to 3 hours of changes. Two needed none.

full time equivalents on a single build
Up to 4full time equivalents on a single build
hours for an initial build
1 to 175hours for an initial build
for wireframes and print files
Illustratorfor wireframes and print files
for client decks
PowerPointfor client decks

Drug, brand and study names are placeholders, as on the original slides. Where a sketch or a spreadsheet named them, they are covered or blurred.